
 Yahoo Finance
 Should You Worry About Empire Industries Ltd’s (CVE:EIL) CEO Salary Level?

Kenneth Nelson became the CEO of Empire Industries Ltd (CVE:EIL) in 2006. This report will, first, examine the CEO compensation levels in comparison to CEO compensation at companies of similar size. Next, we’ll consider growth that the business demonstrates. And finally – as a second measure of performance – we will look at the returns shareholders have received over the last few years. This method should give us information to assess how appropriately the company pays the CEO.
View our latest analysis for Empire Industries
How Does Kenneth Nelson’s Compensation Compare With Similar Sized Companies?
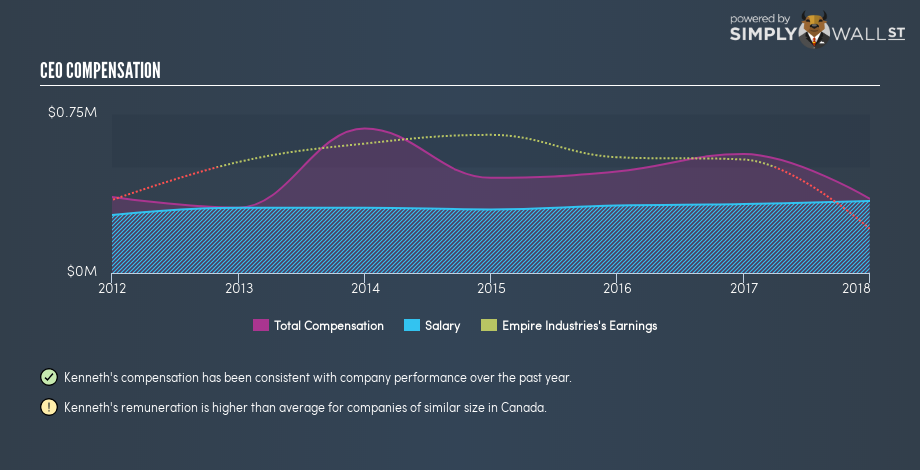
Our data indicates that Empire Industries Ltd is worth CA$42m, and total annual CEO compensation is CA$351k. (This is based on the year to 2017). It is worth noting that the CEO compensation consists almost entirely of the salary, worth CA$340k. We looked at a group of companies with market capitalizations under CA$266m, and the median CEO compensation was CA$156k.
As you can see, Kenneth Nelson is paid more than the median CEO pay at companies of a similar size, in the same market. However, this does not necessarily mean Empire Industries Ltd is paying too much. We can get a better idea of how generous the pay is by looking at the performance of the underlying business.
You can see, below, how CEO compensation at Empire Industries has changed over time.
Is Empire Industries Ltd Growing?
Over the last three years Empire Industries Ltd has shrunk its earnings per share by an average of 105% per year. Its revenue is up 8.3% over last year.
Few shareholders would be pleased to read that earnings per share are lower over three years. And the modest revenue growth over 12 months isn’t much comfort against the reduced earnings per share. These factors suggest that the business performance wouldn’t really justify a high pay packet for the CEO.
We don’t have analyst forecasts, but you might want to assess this data-rich visualization of earnings, revenue and cash flow.
Has Empire Industries Ltd Been A Good Investment?
I think that the total shareholder return of 35%, over three years, would leave most Empire Industries Ltd shareholders smiling. This strong performance might mean some shareholders don’t mind if the CEO is paid more than is normal for a company of its size.
In Summary…
We compared the total CEO remuneration paid by Empire Industries Ltd, and compared it to remuneration at a group of similar sized companies. Our data suggests that it pays above the median CEO pay within that group.
We think many shareholders would be underwhelmed with the business growth over the last three years.
However, we can’t argue with the strong returns to shareholders, over the same time period. Given this situation we doubt shareholders are particularly concerned about the CEO compensation. CEO compensation is one thing, but it is also interesting to check if the CEO is buying or selling Empire Industries (free visualization of insider trades).
Or you could feast your eyes on this interactive graph depicting past earnings, cash flow and revenue.
To help readers see past the short term volatility of the financial market, we aim to bring you a long-term focused research analysis purely driven by fundamental data. Note that our analysis does not factor in the latest price-sensitive company announcements.
The author is an independent contributor and at the time of publication had no position in the stocks mentioned. For errors that warrant correction please contact the editor at editorial-team@simplywallst.com.
