
 Yahoo Finance
 Should You Worry About Caesarstone Ltd.’s (NASDAQ:CSTE) ROCE?

Today we'll evaluate Caesarstone Ltd. (NASDAQ:CSTE) to determine whether it could have potential as an investment idea. To be precise, we'll consider its Return On Capital Employed (ROCE), as that will inform our view of the quality of the business.
Firstly, we'll go over how we calculate ROCE. Then we'll compare its ROCE to similar companies. Then we'll determine how its current liabilities are affecting its ROCE.
What is Return On Capital Employed (ROCE)?
ROCE measures the amount of pre-tax profits a company can generate from the capital employed in its business. In general, businesses with a higher ROCE are usually better quality. Ultimately, it is a useful but imperfect metric. Renowned investment researcher Michael Mauboussin has suggested that a high ROCE can indicate that 'one dollar invested in the company generates value of more than one dollar'.
So, How Do We Calculate ROCE?
The formula for calculating the return on capital employed is:
Return on Capital Employed = Earnings Before Interest and Tax (EBIT) ÷ (Total Assets - Current Liabilities)
Or for Caesarstone:
0.067 = US$39m ÷ (US$694m - US$108m) (Based on the trailing twelve months to September 2019.)
Therefore, Caesarstone has an ROCE of 6.7%.
View our latest analysis for Caesarstone
Is Caesarstone's ROCE Good?
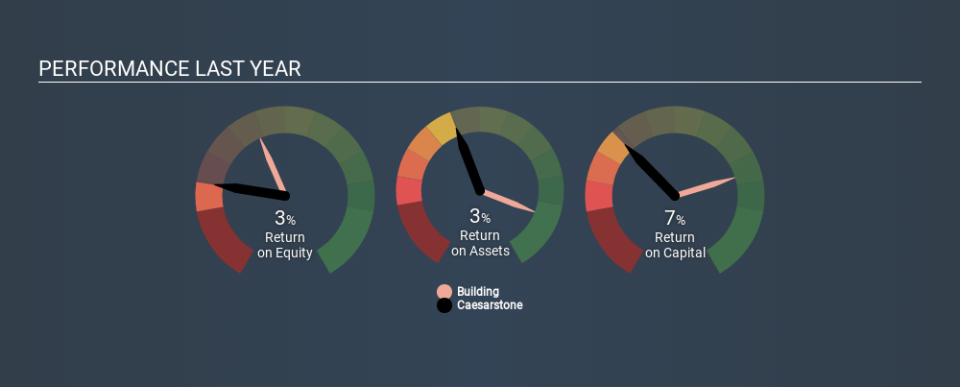
ROCE can be useful when making comparisons, such as between similar companies. We can see Caesarstone's ROCE is meaningfully below the Building industry average of 13%. This performance could be negative if sustained, as it suggests the business may underperform its industry. Separate from how Caesarstone stacks up against its industry, its ROCE in absolute terms is mediocre; relative to the returns on government bonds. Investors may wish to consider higher-performing investments.
Caesarstone's current ROCE of 6.7% is lower than 3 years ago, when the company reported a 21% ROCE. This makes us wonder if the business is facing new challenges. The image below shows how Caesarstone's ROCE compares to its industry, and you can click it to see more detail on its past growth.
It is important to remember that ROCE shows past performance, and is not necessarily predictive. ROCE can be misleading for companies in cyclical industries, with returns looking impressive during the boom times, but very weak during the busts. ROCE is, after all, simply a snap shot of a single year. What happens in the future is pretty important for investors, so we have prepared a free report on analyst forecasts for Caesarstone.
Do Caesarstone's Current Liabilities Skew Its ROCE?
Liabilities, such as supplier bills and bank overdrafts, are referred to as current liabilities if they need to be paid within 12 months. Due to the way ROCE is calculated, a high level of current liabilities makes a company look as though it has less capital employed, and thus can (sometimes unfairly) boost the ROCE. To check the impact of this, we calculate if a company has high current liabilities relative to its total assets.
Caesarstone has total assets of US$694m and current liabilities of US$108m. Therefore its current liabilities are equivalent to approximately 16% of its total assets. It is good to see a restrained amount of current liabilities, as this limits the effect on ROCE.
The Bottom Line On Caesarstone's ROCE
That said, Caesarstone's ROCE is mediocre, there may be more attractive investments around. Of course, you might find a fantastic investment by looking at a few good candidates. So take a peek at this free list of companies with modest (or no) debt, trading on a P/E below 20.
I will like Caesarstone better if I see some big insider buys. While we wait, check out this free list of growing companies with considerable, recent, insider buying.
If you spot an error that warrants correction, please contact the editor at editorial-team@simplywallst.com. This article by Simply Wall St is general in nature. It does not constitute a recommendation to buy or sell any stock, and does not take account of your objectives, or your financial situation. Simply Wall St has no position in the stocks mentioned.
We aim to bring you long-term focused research analysis driven by fundamental data. Note that our analysis may not factor in the latest price-sensitive company announcements or qualitative material. Thank you for reading.
