
 Yahoo Finance
 Should You Worry About 5N Plus Inc.’s (TSE:VNP) CEO Pay Cheque?

Want to participate in a short research study? Help shape the future of investing tools and you could win a $250 gift card!
AJ Roshan became the CEO of 5N Plus Inc. (TSE:VNP) in 2016. This report will, first, examine the CEO compensation levels in comparison to CEO compensation at companies of similar size. Then we’ll look at a snap shot of the business growth. And finally we will reflect on how common stockholders have fared in the last few years, as a secondary measure of performance. This process should give us an idea about how appropriately the CEO is paid.
See our latest analysis for 5N Plus
How Does AJ Roshan’s Compensation Compare With Similar Sized Companies?
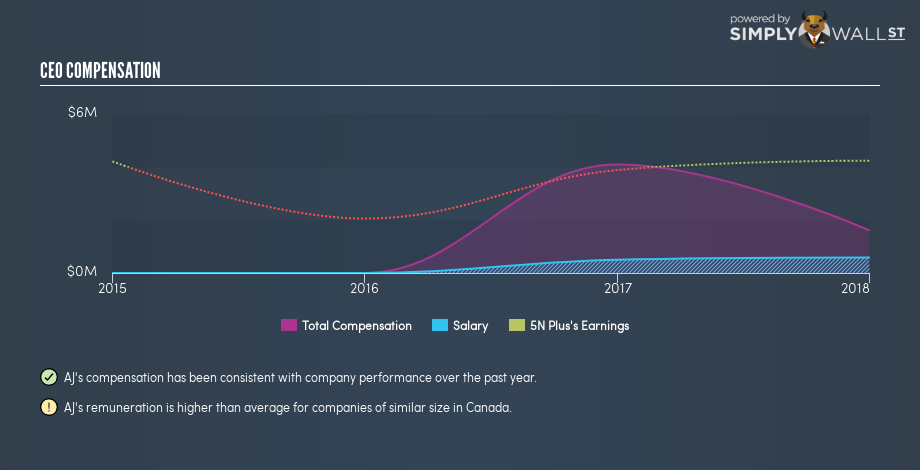
Our data indicates that 5N Plus Inc. is worth CA$273m, and total annual CEO compensation is US$1.6m. (This number is for the twelve months until 2017). We think total compensation is more important but we note that the CEO salary is lower, at US$585k. As part of our analysis we looked at companies in the same jurisdiction, with market capitalizations of CA$131m to CA$526m. The median total CEO compensation was CA$858k.
As you can see, AJ Roshan is paid more than the median CEO pay at companies of a similar size, in the same market. However, this does not necessarily mean 5N Plus Inc. is paying too much. We can get a better idea of how generous the pay is by looking at the performance of the underlying business.
The graphic below shows how CEO compensation at 5N Plus has changed from year to year.
Is 5N Plus Inc. Growing?
On average over the last three years, 5N Plus Inc. has grown earnings per share (EPS) by 115% each year (using a line of best fit). Revenue was pretty flat on last year.
This shows that the company has improved itself over the last few years. Good news for shareholders. It’s good to see a bit of revenue growth, as this suggests the business is able to grow sustainably. Shareholders might be interested in this free visualization of analyst forecasts.
Has 5N Plus Inc. Been A Good Investment?
Most shareholders would probably be pleased with 5N Plus Inc. for providing a total return of 156% over three years. This strong performance might mean some shareholders don’t mind if the CEO were to be paid more than is normal for a company of its size.
In Summary…
We compared the total CEO remuneration paid by 5N Plus Inc., and compared it to remuneration at a group of similar sized companies. Our data suggests that it pays above the median CEO pay within that group.
However, the earnings per share growth over three years is certainly impressive. On top of that, in the same period, returns to shareholders have been great. Considering this fine result for shareholders, we daresay the CEO compensation might be apt. So you may want to check if insiders are buying 5N Plus shares with their own money (free access).
If you want to buy a stock that is better than 5N Plus, this free list of high return, low debt companies is a great place to look.
To help readers see past the short term volatility of the financial market, we aim to bring you a long-term focused research analysis purely driven by fundamental data. Note that our analysis does not factor in the latest price-sensitive company announcements.
The author is an independent contributor and at the time of publication had no position in the stocks mentioned. For errors that warrant correction please contact the editor at editorial-team@simplywallst.com.
