
 Yahoo Finance
 Workday (NASDAQ:WDAY) Is Looking To Continue Growing Its Returns On Capital
If you're not sure where to start when looking for the next multi-bagger, there are a few key trends you should keep an eye out for. Ideally, a business will show two trends; firstly a growing return on capital employed (ROCE) and secondly, an increasing amount of capital employed. Put simply, these types of businesses are compounding machines, meaning they are continually reinvesting their earnings at ever-higher rates of return. With that in mind, we've noticed some promising trends at Workday (NASDAQ:WDAY) so let's look a bit deeper.
Return On Capital Employed (ROCE): What Is It?
For those who don't know, ROCE is a measure of a company's yearly pre-tax profit (its return), relative to the capital employed in the business. To calculate this metric for Workday, this is the formula:
Return on Capital Employed = Earnings Before Interest and Tax (EBIT) ÷ (Total Assets - Current Liabilities)
0.023 = US$267m ÷ (US$16b - US$4.4b) (Based on the trailing twelve months to April 2024).
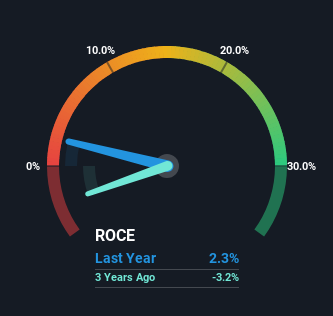
Thus, Workday has an ROCE of 2.3%. In absolute terms, that's a low return and it also under-performs the Software industry average of 7.2%.
Check out our latest analysis for Workday
In the above chart we have measured Workday's prior ROCE against its prior performance, but the future is arguably more important. If you're interested, you can view the analysts predictions in our free analyst report for Workday .
How Are Returns Trending?
The fact that Workday is now generating some pre-tax profits from its prior investments is very encouraging. Shareholders would no doubt be pleased with this because the business was loss-making five years ago but is is now generating 2.3% on its capital. Not only that, but the company is utilizing 241% more capital than before, but that's to be expected from a company trying to break into profitability. This can tell us that the company has plenty of reinvestment opportunities that are able to generate higher returns.
On a related note, the company's ratio of current liabilities to total assets has decreased to 28%, which basically reduces it's funding from the likes of short-term creditors or suppliers. So this improvement in ROCE has come from the business' underlying economics, which is great to see.
The Key Takeaway
In summary, it's great to see that Workday has managed to break into profitability and is continuing to reinvest in its business. And given the stock has remained rather flat over the last five years, there might be an opportunity here if other metrics are strong. With that in mind, we believe the promising trends warrant this stock for further investigation.
Before jumping to any conclusions though, we need to know what value we're getting for the current share price. That's where you can check out our FREE intrinsic value estimation for WDAY that compares the share price and estimated value.
For those who like to invest in solid companies, check out this free list of companies with solid balance sheets and high returns on equity.
Have feedback on this article? Concerned about the content? Get in touch with us directly. Alternatively, email editorial-team (at) simplywallst.com.
This article by Simply Wall St is general in nature. We provide commentary based on historical data and analyst forecasts only using an unbiased methodology and our articles are not intended to be financial advice. It does not constitute a recommendation to buy or sell any stock, and does not take account of your objectives, or your financial situation. We aim to bring you long-term focused analysis driven by fundamental data. Note that our analysis may not factor in the latest price-sensitive company announcements or qualitative material. Simply Wall St has no position in any stocks mentioned.
Have feedback on this article? Concerned about the content? Get in touch with us directly. Alternatively, email editorial-team@simplywallst.com
