
 Yahoo Finance
 Why We're Not Concerned About Baijiayun Group Ltd's (NASDAQ:RTC) Share Price
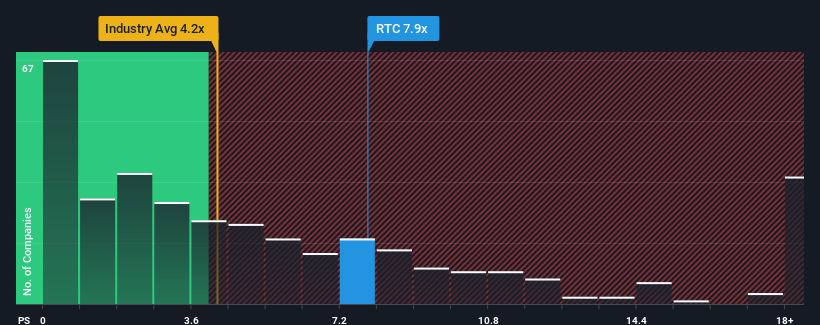
With a price-to-sales (or "P/S") ratio of 7.9x Baijiayun Group Ltd (NASDAQ:RTC) may be sending very bearish signals at the moment, given that almost half of all the Software companies in the United States have P/S ratios under 4.2x and even P/S lower than 1.8x are not unusual. Nonetheless, we'd need to dig a little deeper to determine if there is a rational basis for the highly elevated P/S.
Check out our latest analysis for Baijiayun Group
What Does Baijiayun Group's Recent Performance Look Like?
With revenue growth that's exceedingly strong of late, Baijiayun Group has been doing very well. The P/S ratio is probably high because investors think this strong revenue growth will be enough to outperform the broader industry in the near future. You'd really hope so, otherwise you're paying a pretty hefty price for no particular reason.
We don't have analyst forecasts, but you can see how recent trends are setting up the company for the future by checking out our free report on Baijiayun Group's earnings, revenue and cash flow.
Is There Enough Revenue Growth Forecasted For Baijiayun Group?
The only time you'd be truly comfortable seeing a P/S as steep as Baijiayun Group's is when the company's growth is on track to outshine the industry decidedly.
Retrospectively, the last year delivered an exceptional 42% gain to the company's top line. The strong recent performance means it was also able to grow revenue by 236% in total over the last three years. Accordingly, shareholders would have definitely welcomed those medium-term rates of revenue growth.
Comparing that to the industry, which is only predicted to deliver 13% growth in the next 12 months, the company's momentum is stronger based on recent medium-term annualised revenue results.
In light of this, it's understandable that Baijiayun Group's P/S sits above the majority of other companies. Presumably shareholders aren't keen to offload something they believe will continue to outmanoeuvre the wider industry.
What We Can Learn From Baijiayun Group's P/S?
It's argued the price-to-sales ratio is an inferior measure of value within certain industries, but it can be a powerful business sentiment indicator.
As we suspected, our examination of Baijiayun Group revealed its three-year revenue trends are contributing to its high P/S, given they look better than current industry expectations. At this stage investors feel the potential continued revenue growth in the future is great enough to warrant an inflated P/S. Unless the recent medium-term conditions change, they will continue to provide strong support to the share price.
The company's balance sheet is another key area for risk analysis. You can assess many of the main risks through our free balance sheet analysis for Baijiayun Group with six simple checks.
If you're unsure about the strength of Baijiayun Group's business, why not explore our interactive list of stocks with solid business fundamentals for some other companies you may have missed.
Have feedback on this article? Concerned about the content? Get in touch with us directly. Alternatively, email editorial-team (at) simplywallst.com.
This article by Simply Wall St is general in nature. We provide commentary based on historical data and analyst forecasts only using an unbiased methodology and our articles are not intended to be financial advice. It does not constitute a recommendation to buy or sell any stock, and does not take account of your objectives, or your financial situation. We aim to bring you long-term focused analysis driven by fundamental data. Note that our analysis may not factor in the latest price-sensitive company announcements or qualitative material. Simply Wall St has no position in any stocks mentioned.
Join A Paid User Research Session
You’ll receive a US$30 Amazon Gift card for 1 hour of your time while helping us build better investing tools for the individual investors like yourself. Sign up here
