
 Yahoo Finance
 Why We Like Vector Group Ltd.’s (NYSE:VGR) 29% Return On Capital Employed

Want to participate in a short research study? Help shape the future of investing tools and you could win a $250 gift card!
Today we’ll evaluate Vector Group Ltd. (NYSE:VGR) to determine whether it could have potential as an investment idea. Specifically, we’ll consider its Return On Capital Employed (ROCE), since that will give us an insight into how efficiently the business can generate profits from the capital it requires.
Firstly, we’ll go over how we calculate ROCE. Second, we’ll look at its ROCE compared to similar companies. Then we’ll determine how its current liabilities are affecting its ROCE.
Understanding Return On Capital Employed (ROCE)
ROCE is a measure of a company’s yearly pre-tax profit (its return), relative to the capital employed in the business. All else being equal, a better business will have a higher ROCE. Overall, it is a valuable metric that has its flaws. Author Edwin Whiting says to be careful when comparing the ROCE of different businesses, since ‘No two businesses are exactly alike.’
So, How Do We Calculate ROCE?
Analysts use this formula to calculate return on capital employed:
Return on Capital Employed = Earnings Before Interest and Tax (EBIT) ÷ (Total Assets – Current Liabilities)
Or for Vector Group:
0.29 = US$253m ÷ (US$1.3b – US$524m) (Based on the trailing twelve months to September 2018.)
Therefore, Vector Group has an ROCE of 29%.
Check out our latest analysis for Vector Group
Is Vector Group’s ROCE Good?
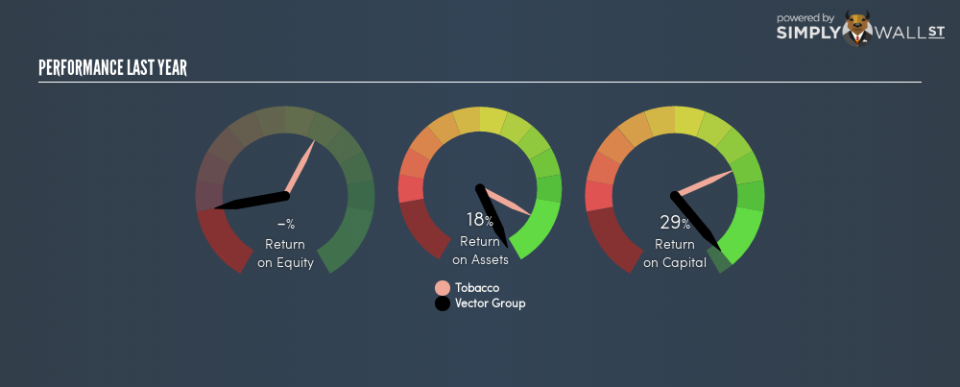
ROCE is commonly used for comparing the performance of similar businesses. In our analysis, Vector Group’s ROCE is meaningfully higher than the 14% average in the Tobacco industry. We would consider this a positive, as it suggests it is using capital more effectively than other similar companies. Putting aside its position relative to its industry for now, in absolute terms, Vector Group’s ROCE is currently very good.
In our analysis, Vector Group’s ROCE appears to be 29%, compared to 3 years ago, when its ROCE was 20%. This makes us wonder if the company is improving.
When considering ROCE, bear in mind that it reflects the past and does not necessarily predict the future. Companies in cyclical industries can be difficult to understand using ROCE, as returns typically look high during boom times, and low during busts. ROCE is only a point-in-time measure. What happens in the future is pretty important for investors, so we have prepared a free report on analyst forecasts for Vector Group.
What Are Current Liabilities, And How Do They Affect Vector Group’s ROCE?
Current liabilities include invoices, such as supplier payments, short-term debt, or a tax bill, that need to be paid within 12 months. The ROCE equation subtracts current liabilities from capital employed, so a company with a lot of current liabilities appears to have less capital employed, and a higher ROCE than otherwise. To counteract this, we check if a company has high current liabilities, relative to its total assets.
Vector Group has total liabilities of US$524m and total assets of US$1.3b. Therefore its current liabilities are equivalent to approximately 39% of its total assets. Vector Group’s ROCE is boosted somewhat by its middling amount of current liabilities.
What We Can Learn From Vector Group’s ROCE
Even so, it has a great ROCE, and could be an attractive prospect for further research. Of course, you might find a fantastic investment by looking at a few good candidates. So take a peek at this free list of companies with modest (or no) debt, trading on a P/E below 20.
For those who like to find winning investments this free list of growing companies with recent insider purchasing, could be just the ticket.
To help readers see past the short term volatility of the financial market, we aim to bring you a long-term focused research analysis purely driven by fundamental data. Note that our analysis does not factor in the latest price-sensitive company announcements.
The author is an independent contributor and at the time of publication had no position in the stocks mentioned. For errors that warrant correction please contact the editor at editorial-team@simplywallst.com.
