
 Yahoo Finance
 Why TFI International Inc. (TSE:TFII) Is A Top Dividend Stock

Want to participate in a short research study? Help shape the future of investing tools and you could win a $250 gift card!
Dividend paying stocks like TFI International Inc. (TSE:TFII) tend to be popular with investors, and for good reason - some research suggests a significant amount of all stock market returns come from reinvested dividends. On the other hand, investors have been known to buy a stock because of its yield, and then lose money if the company's dividend doesn't live up to expectations.
A 2.2% yield is nothing to get excited about, but investors probably think the long payment history suggests TFI International has some staying power. The company also bought back stock equivalent to around 5.1% of market capitalisation this year. Some simple research can reduce the risk of buying TFI International for its dividend - read on to learn more.
Explore this interactive chart for our latest analysis on TFI International!
Payout ratios
Companies (usually) pay dividends out of their earnings. If a company is paying more than it earns, the dividend might have to be cut. As a result, we should always investigate whether a company can afford its dividend, measured as a percentage of a company's net income after tax. Looking at the data, we can see that 25% of TFI International's profits were paid out as dividends in the last 12 months. This is medium payout level that leaves enough capital in the business to fund opportunities that might arise, while also rewarding shareholders. Besides, if reinvestment opportunities dry up, the company has room to increase the dividend.
In addition to comparing dividends against profits, we should inspect whether the company generated enough cash to pay its dividend. TFI International's cash payout ratio last year was 23%. Cash flows are typically lumpy, but this looks like an appropriately conservative payout. It's encouraging to see that the dividend is covered by both profit and cash flow. This generally suggests the dividend is sustainable, as long as earnings don't drop precipitously.
Is TFI International's Balance Sheet Risky?
As TFI International has a meaningful amount of debt, we need to check its balance sheet to see if the company might have debt risks. A rough way to check this is with these two simple ratios: a) net debt divided by EBITDA (earnings before interest, tax, depreciation and amortisation), and b) net interest cover. Net debt to EBITDA measures a company's total debt load relative to its earnings (lower = less debt), while net interest cover measures the company's ability to pay the interest on its debt (higher = greater ability to pay interest costs). TFI International has net debt of more than 3x its EBITDA, which is getting towards the limit of most investors' comfort zones. Judicious use of debt can enhance shareholder returns, but also adds to the risk if something goes awry.
Net interest cover can be calculated by dividing earnings before interest and tax (EBIT) by the company's net interest expense. Net interest cover of 7.79 times its interest expense appears reasonable for TFI International, although we're conscious that even high interest cover doesn't make a company bulletproof.
Remember, you can always get a snapshot of TFI International's latest financial position, by checking our visualisation of its financial health.
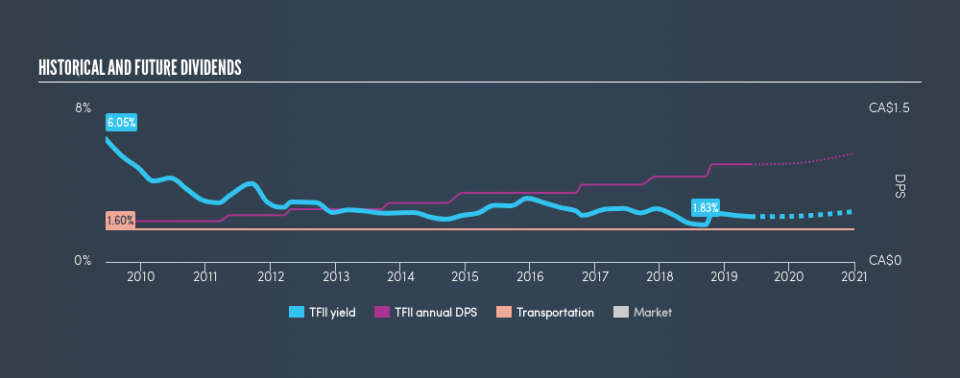
Dividend Volatility
Before buying a stock for its income, we want to see if the dividends have been stable in the past, and if the company has a track record of maintaining its dividend. TFI International has been paying dividends for a long time, but for the purpose of this analysis, we only examine the past 10 years of payments. During this period the dividend has been stable, which could imply the business could have relatively consistent earnings power. During the past ten-year period, the first annual payment was CA$0.40 in 2009, compared to CA$0.96 last year. This works out to be a compound annual growth rate (CAGR) of approximately 9.1% a year over that time.
Dividends have grown at a reasonable rate over this period, and without any major cuts in the payment over time, we think this is an attractive combination.
Dividend Growth Potential
Dividend payments have been consistent over the past few years, but we should always check if earnings per share (EPS) are growing, as this will help maintain the purchasing power of the dividend. It's good to see TFI International has been growing its earnings per share at 39% a year over the past 5 years. With high earnings per share growth in recent times and a modest payout ratio, we think this is an attractive combination if earnings can be reinvested to generate further growth.
Conclusion
To summarise, shareholders should always check that TFI International's dividends are affordable, that its dividend payments are relatively stable, and that it has decent prospects for growing its earnings and dividend. It's great to see that TFI International is paying out a low percentage of its earnings and cash flow. That said, we were glad to see it growing earnings and paying a fairly consistent dividend. All these things considered, we think this organisation has a lot going for it from a dividend perspective.
Earnings growth generally bodes well for the future value of company dividend payments. See if the 13 TFI International analysts we track are forecasting continued growth with our free report on analyst estimates for the company.
We have also put together a list of global stocks with a market capitalisation above $1bn and yielding more 3%.
We aim to bring you long-term focused research analysis driven by fundamental data. Note that our analysis may not factor in the latest price-sensitive company announcements or qualitative material.
If you spot an error that warrants correction, please contact the editor at editorial-team@simplywallst.com. This article by Simply Wall St is general in nature. It does not constitute a recommendation to buy or sell any stock, and does not take account of your objectives, or your financial situation. Simply Wall St has no position in the stocks mentioned. Thank you for reading.
