
 Yahoo Finance
 Why You Should Like Simulations Plus, Inc.’s (NASDAQ:SLP) ROCE

Today we'll look at Simulations Plus, Inc. (NASDAQ:SLP) and reflect on its potential as an investment. Specifically, we'll consider its Return On Capital Employed (ROCE), since that will give us an insight into how efficiently the business can generate profits from the capital it requires.
First of all, we'll work out how to calculate ROCE. Then we'll compare its ROCE to similar companies. And finally, we'll look at how its current liabilities are impacting its ROCE.
Return On Capital Employed (ROCE): What is it?
ROCE measures the 'return' (pre-tax profit) a company generates from capital employed in its business. In general, businesses with a higher ROCE are usually better quality. In brief, it is a useful tool, but it is not without drawbacks. Author Edwin Whiting says to be careful when comparing the ROCE of different businesses, since 'No two businesses are exactly alike.'
So, How Do We Calculate ROCE?
The formula for calculating the return on capital employed is:
Return on Capital Employed = Earnings Before Interest and Tax (EBIT) ÷ (Total Assets - Current Liabilities)
Or for Simulations Plus:
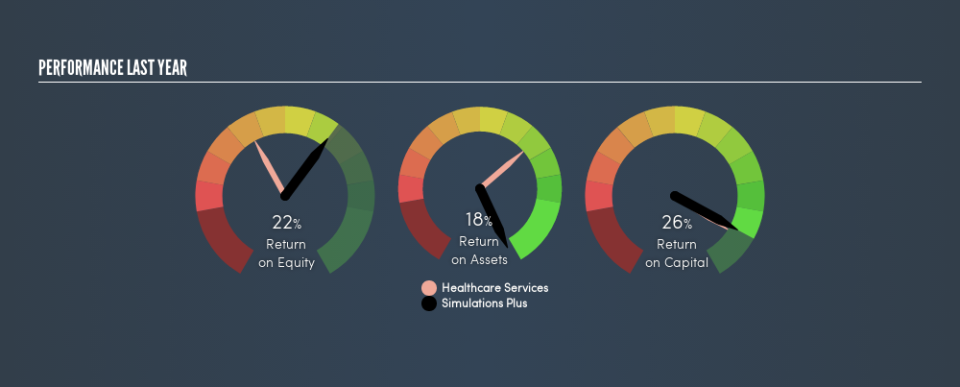
0.26 = US$11m ÷ (US$46m - US$5.1m) (Based on the trailing twelve months to May 2019.)
So, Simulations Plus has an ROCE of 26%.
View our latest analysis for Simulations Plus
Is Simulations Plus's ROCE Good?
ROCE is commonly used for comparing the performance of similar businesses. Using our data, we find that Simulations Plus's ROCE is meaningfully better than the 7.5% average in the Healthcare Services industry. I think that's good to see, since it implies the company is better than other companies at making the most of its capital. Putting aside its position relative to its industry for now, in absolute terms, Simulations Plus's ROCE is currently very good.
The image below shows how Simulations Plus's ROCE compares to its industry, and you can click it to see more detail on its past growth.
Remember that this metric is backwards looking - it shows what has happened in the past, and does not accurately predict the future. ROCE can be deceptive for cyclical businesses, as returns can look incredible in boom times, and terribly low in downturns. ROCE is, after all, simply a snap shot of a single year. Future performance is what matters, and you can see analyst predictions in our free report on analyst forecasts for the company.
Simulations Plus's Current Liabilities And Their Impact On Its ROCE
Liabilities, such as supplier bills and bank overdrafts, are referred to as current liabilities if they need to be paid within 12 months. Due to the way the ROCE equation works, having large bills due in the near term can make it look as though a company has less capital employed, and thus a higher ROCE than usual. To counteract this, we check if a company has high current liabilities, relative to its total assets.
Simulations Plus has total liabilities of US$5.1m and total assets of US$46m. As a result, its current liabilities are equal to approximately 11% of its total assets. This is quite a low level of current liabilities which would not greatly boost the already high ROCE.
The Bottom Line On Simulations Plus's ROCE
Low current liabilities and high ROCE is a good combination, making Simulations Plus look quite interesting. Simulations Plus looks strong on this analysis, but there are plenty of other companies that could be a good opportunity . Here is a free list of companies growing earnings rapidly.
I will like Simulations Plus better if I see some big insider buys. While we wait, check out this free list of growing companies with considerable, recent, insider buying.
We aim to bring you long-term focused research analysis driven by fundamental data. Note that our analysis may not factor in the latest price-sensitive company announcements or qualitative material.
If you spot an error that warrants correction, please contact the editor at editorial-team@simplywallst.com. This article by Simply Wall St is general in nature. It does not constitute a recommendation to buy or sell any stock, and does not take account of your objectives, or your financial situation. Simply Wall St has no position in the stocks mentioned. Thank you for reading.
