
 Yahoo Finance
 Why We Like The Returns At Wabash National (NYSE:WNC)
Did you know there are some financial metrics that can provide clues of a potential multi-bagger? Firstly, we'd want to identify a growing return on capital employed (ROCE) and then alongside that, an ever-increasing base of capital employed. This shows us that it's a compounding machine, able to continually reinvest its earnings back into the business and generate higher returns. Speaking of which, we noticed some great changes in Wabash National's (NYSE:WNC) returns on capital, so let's have a look.
Understanding Return On Capital Employed (ROCE)
If you haven't worked with ROCE before, it measures the 'return' (pre-tax profit) a company generates from capital employed in its business. The formula for this calculation on Wabash National is:
Return on Capital Employed = Earnings Before Interest and Tax (EBIT) ÷ (Total Assets - Current Liabilities)
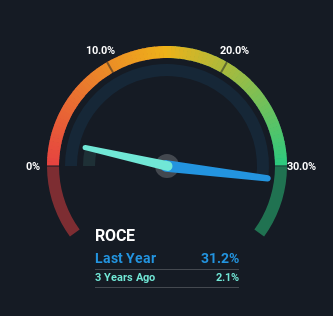
0.31 = US$315m ÷ (US$1.4b - US$352m) (Based on the trailing twelve months to December 2023).
Therefore, Wabash National has an ROCE of 31%. In absolute terms that's a great return and it's even better than the Machinery industry average of 13%.
See our latest analysis for Wabash National
In the above chart we have measured Wabash National's prior ROCE against its prior performance, but the future is arguably more important. If you're interested, you can view the analysts predictions in our free analyst report for Wabash National .
The Trend Of ROCE
Wabash National's ROCE growth is quite impressive. The figures show that over the last five years, ROCE has grown 137% whilst employing roughly the same amount of capital. So it's likely that the business is now reaping the full benefits of its past investments, since the capital employed hasn't changed considerably. On that front, things are looking good so it's worth exploring what management has said about growth plans going forward.
Our Take On Wabash National's ROCE
To sum it up, Wabash National is collecting higher returns from the same amount of capital, and that's impressive. And a remarkable 129% total return over the last five years tells us that investors are expecting more good things to come in the future. In light of that, we think it's worth looking further into this stock because if Wabash National can keep these trends up, it could have a bright future ahead.
If you'd like to know more about Wabash National, we've spotted 2 warning signs, and 1 of them makes us a bit uncomfortable.
High returns are a key ingredient to strong performance, so check out our free list ofstocks earning high returns on equity with solid balance sheets.
Have feedback on this article? Concerned about the content? Get in touch with us directly. Alternatively, email editorial-team (at) simplywallst.com.
This article by Simply Wall St is general in nature. We provide commentary based on historical data and analyst forecasts only using an unbiased methodology and our articles are not intended to be financial advice. It does not constitute a recommendation to buy or sell any stock, and does not take account of your objectives, or your financial situation. We aim to bring you long-term focused analysis driven by fundamental data. Note that our analysis may not factor in the latest price-sensitive company announcements or qualitative material. Simply Wall St has no position in any stocks mentioned.
