
 Yahoo Finance
 Why We Like The Returns At Major Drilling Group International (TSE:MDI)
If we want to find a stock that could multiply over the long term, what are the underlying trends we should look for? Ideally, a business will show two trends; firstly a growing return on capital employed (ROCE) and secondly, an increasing amount of capital employed. Put simply, these types of businesses are compounding machines, meaning they are continually reinvesting their earnings at ever-higher rates of return. With that in mind, the ROCE of Major Drilling Group International (TSE:MDI) looks great, so lets see what the trend can tell us.
What Is Return On Capital Employed (ROCE)?
If you haven't worked with ROCE before, it measures the 'return' (pre-tax profit) a company generates from capital employed in its business. The formula for this calculation on Major Drilling Group International is:
Return on Capital Employed = Earnings Before Interest and Tax (EBIT) ÷ (Total Assets - Current Liabilities)
0.22 = CA$102m ÷ (CA$575m - CA$100m) (Based on the trailing twelve months to January 2023).
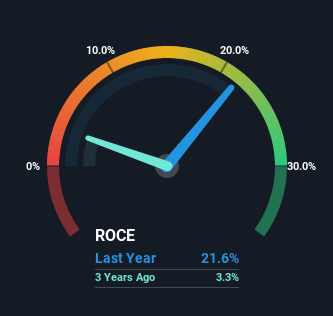
So, Major Drilling Group International has an ROCE of 22%. In absolute terms that's a great return and it's even better than the Metals and Mining industry average of 3.5%.
Check out our latest analysis for Major Drilling Group International
Above you can see how the current ROCE for Major Drilling Group International compares to its prior returns on capital, but there's only so much you can tell from the past. If you'd like, you can check out the forecasts from the analysts covering Major Drilling Group International here for free.
The Trend Of ROCE
We're delighted to see that Major Drilling Group International is reaping rewards from its investments and has now broken into profitability. The company now earns 22% on its capital, because five years ago it was incurring losses. On top of that, what's interesting is that the amount of capital being employed has remained steady, so the business hasn't needed to put any additional money to work to generate these higher returns. So while we're happy that the business is more efficient, just keep in mind that could mean that going forward the business is lacking areas to invest internally for growth. After all, a company can only become a long term multi-bagger if it continually reinvests in itself at high rates of return.
The Bottom Line On Major Drilling Group International's ROCE
In summary, we're delighted to see that Major Drilling Group International has been able to increase efficiencies and earn higher rates of return on the same amount of capital. And with a respectable 48% awarded to those who held the stock over the last five years, you could argue that these developments are starting to get the attention they deserve. With that being said, we still think the promising fundamentals mean the company deserves some further due diligence.
If you want to continue researching Major Drilling Group International, you might be interested to know about the 1 warning sign that our analysis has discovered.
If you'd like to see other companies earning high returns, check out our free list of companies earning high returns with solid balance sheets here.
Have feedback on this article? Concerned about the content? Get in touch with us directly. Alternatively, email editorial-team (at) simplywallst.com.
This article by Simply Wall St is general in nature. We provide commentary based on historical data and analyst forecasts only using an unbiased methodology and our articles are not intended to be financial advice. It does not constitute a recommendation to buy or sell any stock, and does not take account of your objectives, or your financial situation. We aim to bring you long-term focused analysis driven by fundamental data. Note that our analysis may not factor in the latest price-sensitive company announcements or qualitative material. Simply Wall St has no position in any stocks mentioned.
Join A Paid User Research Session
You’ll receive a US$30 Amazon Gift card for 1 hour of your time while helping us build better investing tools for the individual investors like yourself. Sign up here
