
 Yahoo Finance
 Why We Like The Returns At Major Drilling Group International (TSE:MDI)
Finding a business that has the potential to grow substantially is not easy, but it is possible if we look at a few key financial metrics. Firstly, we'd want to identify a growing return on capital employed (ROCE) and then alongside that, an ever-increasing base of capital employed. Basically this means that a company has profitable initiatives that it can continue to reinvest in, which is a trait of a compounding machine. So when we looked at the ROCE trend of Major Drilling Group International (TSE:MDI) we really liked what we saw.
Understanding Return On Capital Employed (ROCE)
Just to clarify if you're unsure, ROCE is a metric for evaluating how much pre-tax income (in percentage terms) a company earns on the capital invested in its business. The formula for this calculation on Major Drilling Group International is:
Return on Capital Employed = Earnings Before Interest and Tax (EBIT) ÷ (Total Assets - Current Liabilities)
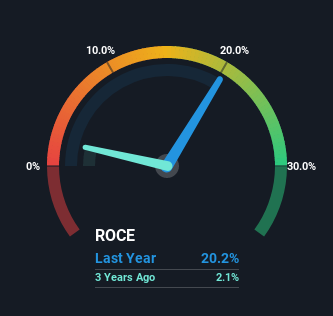
0.20 = CA$89m ÷ (CA$550m - CA$112m) (Based on the trailing twelve months to July 2022).
Thus, Major Drilling Group International has an ROCE of 20%. In absolute terms that's a great return and it's even better than the Metals and Mining industry average of 3.5%.
View our latest analysis for Major Drilling Group International
Above you can see how the current ROCE for Major Drilling Group International compares to its prior returns on capital, but there's only so much you can tell from the past. If you'd like to see what analysts are forecasting going forward, you should check out our free report for Major Drilling Group International.
What The Trend Of ROCE Can Tell Us
Shareholders will be relieved that Major Drilling Group International has broken into profitability. While the business was unprofitable in the past, it's now turned things around and is earning 20% on its capital. Interestingly, the capital employed by the business has remained relatively flat, so these higher returns are either from prior investments paying off or increased efficiencies. So while we're happy that the business is more efficient, just keep in mind that could mean that going forward the business is lacking areas to invest internally for growth. After all, a company can only become a long term multi-bagger if it continually reinvests in itself at high rates of return.
In Conclusion...
As discussed above, Major Drilling Group International appears to be getting more proficient at generating returns since capital employed has remained flat but earnings (before interest and tax) are up. Investors may not be impressed by the favorable underlying trends yet because over the last five years the stock has only returned 11% to shareholders. Given that, we'd look further into this stock in case it has more traits that could make it multiply in the long term.
One more thing to note, we've identified 1 warning sign with Major Drilling Group International and understanding it should be part of your investment process.
If you'd like to see other companies earning high returns, check out our free list of companies earning high returns with solid balance sheets here.
Have feedback on this article? Concerned about the content? Get in touch with us directly. Alternatively, email editorial-team (at) simplywallst.com.
This article by Simply Wall St is general in nature. We provide commentary based on historical data and analyst forecasts only using an unbiased methodology and our articles are not intended to be financial advice. It does not constitute a recommendation to buy or sell any stock, and does not take account of your objectives, or your financial situation. We aim to bring you long-term focused analysis driven by fundamental data. Note that our analysis may not factor in the latest price-sensitive company announcements or qualitative material. Simply Wall St has no position in any stocks mentioned.
Join A Paid User Research Session
You’ll receive a US$30 Amazon Gift card for 1 hour of your time while helping us build better investing tools for the individual investors like yourself. Sign up here
