
 Yahoo Finance
 Why We Like The Returns At Alphabet (NASDAQ:GOOGL)
If we want to find a stock that could multiply over the long term, what are the underlying trends we should look for? Typically, we'll want to notice a trend of growing return on capital employed (ROCE) and alongside that, an expanding base of capital employed. Put simply, these types of businesses are compounding machines, meaning they are continually reinvesting their earnings at ever-higher rates of return. With that in mind, the ROCE of Alphabet (NASDAQ:GOOGL) looks great, so lets see what the trend can tell us.
Understanding Return On Capital Employed (ROCE)
For those who don't know, ROCE is a measure of a company's yearly pre-tax profit (its return), relative to the capital employed in the business. The formula for this calculation on Alphabet is:
Return on Capital Employed = Earnings Before Interest and Tax (EBIT) ÷ (Total Assets - Current Liabilities)
0.29 = US$97b ÷ (US$407b - US$77b) (Based on the trailing twelve months to March 2024).
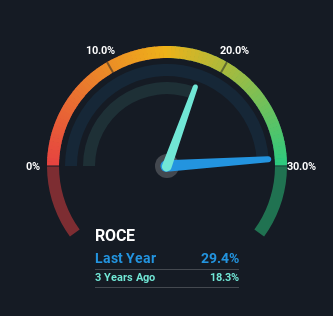
So, Alphabet has an ROCE of 29%. That's a fantastic return and not only that, it outpaces the average of 6.4% earned by companies in a similar industry.
See our latest analysis for Alphabet
Above you can see how the current ROCE for Alphabet compares to its prior returns on capital, but there's only so much you can tell from the past. If you'd like to see what analysts are forecasting going forward, you should check out our free analyst report for Alphabet .
What Can We Tell From Alphabet's ROCE Trend?
Alphabet is displaying some positive trends. Over the last five years, returns on capital employed have risen substantially to 29%. The company is effectively making more money per dollar of capital used, and it's worth noting that the amount of capital has increased too, by 57%. This can indicate that there's plenty of opportunities to invest capital internally and at ever higher rates, a combination that's common among multi-baggers.
Our Take On Alphabet's ROCE
To sum it up, Alphabet has proven it can reinvest in the business and generate higher returns on that capital employed, which is terrific. And a remarkable 237% total return over the last five years tells us that investors are expecting more good things to come in the future. With that being said, we still think the promising fundamentals mean the company deserves some further due diligence.
Before jumping to any conclusions though, we need to know what value we're getting for the current share price. That's where you can check out our FREE intrinsic value estimation for GOOGL that compares the share price and estimated value.
If you'd like to see other companies earning high returns, check out our free list of companies earning high returns with solid balance sheets here.
Have feedback on this article? Concerned about the content? Get in touch with us directly. Alternatively, email editorial-team (at) simplywallst.com.
This article by Simply Wall St is general in nature. We provide commentary based on historical data and analyst forecasts only using an unbiased methodology and our articles are not intended to be financial advice. It does not constitute a recommendation to buy or sell any stock, and does not take account of your objectives, or your financial situation. We aim to bring you long-term focused analysis driven by fundamental data. Note that our analysis may not factor in the latest price-sensitive company announcements or qualitative material. Simply Wall St has no position in any stocks mentioned.
