
 Yahoo Finance
 Why ResMed Inc.'s (NYSE:RMD) High P/E Ratio Isn't Necessarily A Bad Thing

This article is for investors who would like to improve their understanding of price to earnings ratios (P/E ratios). We'll look at ResMed Inc.'s (NYSE:RMD) P/E ratio and reflect on what it tells us about the company's share price. Based on the last twelve months, ResMed's P/E ratio is 53.92. That is equivalent to an earnings yield of about 1.9%.
See our latest analysis for ResMed
How Do You Calculate ResMed's P/E Ratio?
The formula for price to earnings is:
Price to Earnings Ratio = Price per Share ÷ Earnings per Share (EPS)
Or for ResMed:
P/E of 53.92 = $157.58 ÷ $2.92 (Based on the trailing twelve months to September 2019.)
Is A High Price-to-Earnings Ratio Good?
The higher the P/E ratio, the higher the price tag of a business, relative to its trailing earnings. That isn't necessarily good or bad, but a high P/E implies relatively high expectations of what a company can achieve in the future.
Does ResMed Have A Relatively High Or Low P/E For Its Industry?
One good way to get a quick read on what market participants expect of a company is to look at its P/E ratio. You can see in the image below that the average P/E (45.9) for companies in the medical equipment industry is lower than ResMed's P/E.
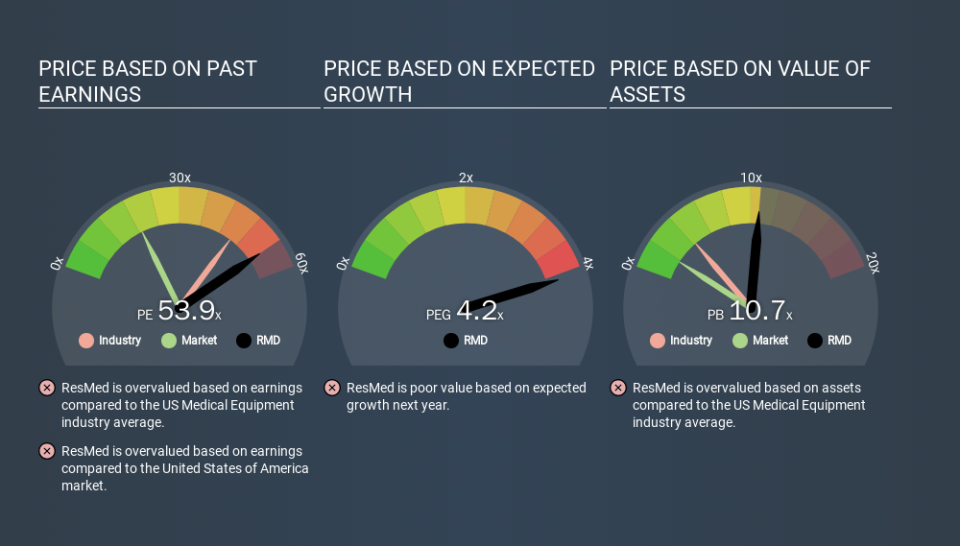
Its relatively high P/E ratio indicates that ResMed shareholders think it will perform better than other companies in its industry classification. Clearly the market expects growth, but it isn't guaranteed. So further research is always essential. I often monitor director buying and selling.
How Growth Rates Impact P/E Ratios
Earnings growth rates have a big influence on P/E ratios. Earnings growth means that in the future the 'E' will be higher. That means even if the current P/E is high, it will reduce over time if the share price stays flat. Then, a lower P/E should attract more buyers, pushing the share price up.
Most would be impressed by ResMed earnings growth of 25% in the last year. And earnings per share have improved by 3.5% annually, over the last five years. With that performance, you might expect an above average P/E ratio.
Remember: P/E Ratios Don't Consider The Balance Sheet
It's important to note that the P/E ratio considers the market capitalization, not the enterprise value. So it won't reflect the advantage of cash, or disadvantage of debt. Theoretically, a business can improve its earnings (and produce a lower P/E in the future) by investing in growth. That means taking on debt (or spending its cash).
Spending on growth might be good or bad a few years later, but the point is that the P/E ratio does not account for the option (or lack thereof).
ResMed's Balance Sheet
ResMed has net debt worth just 4.7% of its market capitalization. It would probably trade on a higher P/E ratio if it had a lot of cash, but I doubt it is having a big impact.
The Bottom Line On ResMed's P/E Ratio
ResMed has a P/E of 53.9. That's higher than the average in its market, which is 18.9. Its debt levels do not imperil its balance sheet and it is growing EPS strongly. Therefore, it's not particularly surprising that it has a above average P/E ratio.
When the market is wrong about a stock, it gives savvy investors an opportunity. If the reality for a company is better than it expects, you can make money by buying and holding for the long term. So this free visualization of the analyst consensus on future earnings could help you make the right decision about whether to buy, sell, or hold.
Of course, you might find a fantastic investment by looking at a few good candidates. So take a peek at this free list of companies with modest (or no) debt, trading on a P/E below 20.
If you spot an error that warrants correction, please contact the editor at editorial-team@simplywallst.com. This article by Simply Wall St is general in nature. It does not constitute a recommendation to buy or sell any stock, and does not take account of your objectives, or your financial situation. Simply Wall St has no position in the stocks mentioned.
We aim to bring you long-term focused research analysis driven by fundamental data. Note that our analysis may not factor in the latest price-sensitive company announcements or qualitative material. Thank you for reading.
