
 Yahoo Finance
 Why Millrock Resources Inc (CVE:MRO) May Not Be As Efficient As Its Industry

The content of this article will benefit those of you who are starting to educate yourself about investing in the stock market and want to learn about Return on Equity using a real-life example.
Millrock Resources Inc (CVE:MRO) generated a below-average return on equity of 3.0% in the past 12 months, while its industry returned 11.7%. An investor may attribute an inferior ROE to a relatively inefficient performance, and whilst this can often be the case, knowing the nuts and bolts of the ROE calculation may change that perspective and give you a deeper insight into MRO’s past performance. I will take you through how metrics such as financial leverage impact ROE which may affect the overall sustainability of MRO’s returns.
See our latest analysis for Millrock Resources
Breaking down Return on Equity
Return on Equity (ROE) weighs Millrock Resources’s profit against the level of its shareholders’ equity. An ROE of 3.0% implies CA$0.030 returned on every CA$1 invested. In most cases, a higher ROE is preferred; however, there are many other factors we must consider prior to making any investment decisions.
Return on Equity = Net Profit ÷ Shareholders Equity
ROE is measured against cost of equity in order to determine the efficiency of Millrock Resources’s equity capital deployed. Its cost of equity is 16.3%. Given a discrepancy of -13.3% between return and cost, this indicated that Millrock Resources may be paying more for its capital than what it’s generating in return. ROE can be dissected into three distinct ratios: net profit margin, asset turnover, and financial leverage. This is called the Dupont Formula:
Dupont Formula
ROE = profit margin × asset turnover × financial leverage
ROE = (annual net profit ÷ sales) × (sales ÷ assets) × (assets ÷ shareholders’ equity)
ROE = annual net profit ÷ shareholders’ equity
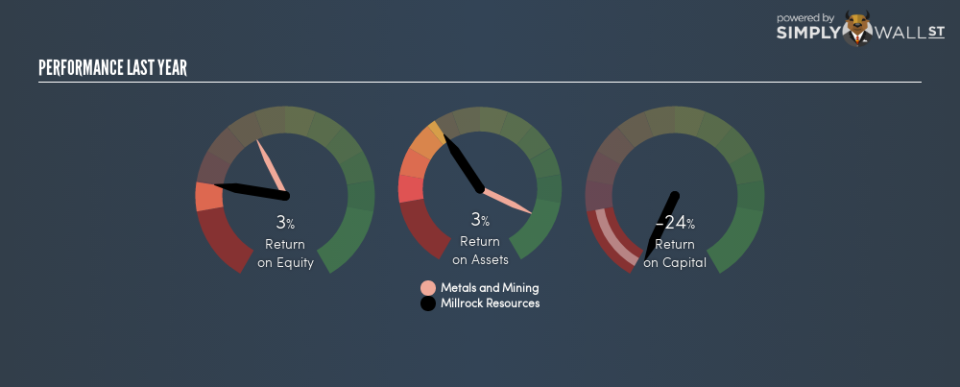
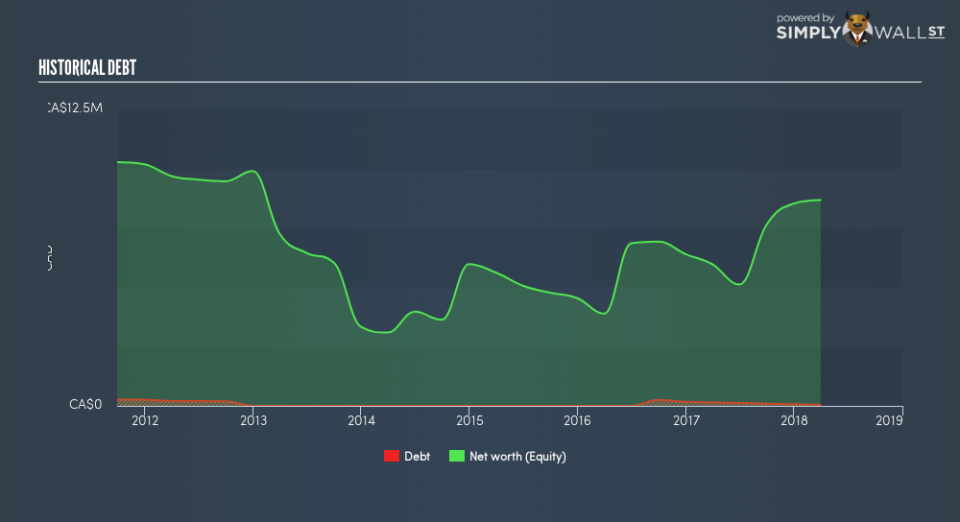
The first component is profit margin, which measures how much of sales is retained after the company pays for all its expenses. The other component, asset turnover, illustrates how much revenue Millrock Resources can make from its asset base. The most interesting ratio, and reflective of sustainability of its ROE, is financial leverage. Since ROE can be artificially increased through excessive borrowing, we should check Millrock Resources’s historic debt-to-equity ratio. Currently Millrock Resources has virtually no debt, which means its returns are predominantly driven by equity capital. This could explain why Millrock Resources’s’ ROE is lower than its industry peers, most of which may have some degree of debt in its business.
Next Steps:
ROE is one of many ratios which meaningfully dissects financial statements, which illustrates the quality of a company. Millrock Resources’s below-industry ROE is disappointing, furthermore, its returns were not even high enough to cover its own cost of equity. Although, its appropriate level of leverage means investors can be more confident in the sustainability of Millrock Resources’s return with a possible increase should the company decide to increase its debt levels. Although ROE can be a useful metric, it is only a small part of diligent research.
For Millrock Resources, I’ve put together three key aspects you should further research:
Financial Health: Does it have a healthy balance sheet? Take a look at our free balance sheet analysis with six simple checks on key factors like leverage and risk.
Management:Have insiders been ramping up their shares to take advantage of the market’s sentiment for Millrock Resources’s future outlook? Check out our management and board analysis with insights on CEO compensation and governance factors.
Other High-Growth Alternatives : Are there other high-growth stocks you could be holding instead of Millrock Resources? Explore our interactive list of stocks with large growth potential to get an idea of what else is out there you may be missing!
To help readers see past the short term volatility of the financial market, we aim to bring you a long-term focused research analysis purely driven by fundamental data. Note that our analysis does not factor in the latest price-sensitive company announcements.
The author is an independent contributor and at the time of publication had no position in the stocks mentioned. For errors that warrant correction please contact the editor at editorial-team@simplywallst.com.
