
 Yahoo Finance
 Why Mainstreet Equity Corp. (TSE:MEQ) Looks Like A Quality Company
One of the best investments we can make is in our own knowledge and skill set. With that in mind, this article will work through how we can use Return On Equity (ROE) to better understand a business. We'll use ROE to examine Mainstreet Equity Corp. (TSE:MEQ), by way of a worked example.
Return on Equity or ROE is a test of how effectively a company is growing its value and managing investors’ money. In simpler terms, it measures the profitability of a company in relation to shareholder's equity.
View our latest analysis for Mainstreet Equity
How Do You Calculate Return On Equity?
Return on equity can be calculated by using the formula:
Return on Equity = Net Profit (from continuing operations) ÷ Shareholders' Equity
So, based on the above formula, the ROE for Mainstreet Equity is:
12% = CA$163m ÷ CA$1.4b (Based on the trailing twelve months to December 2023).
The 'return' is the yearly profit. So, this means that for every CA$1 of its shareholder's investments, the company generates a profit of CA$0.12.
Does Mainstreet Equity Have A Good Return On Equity?
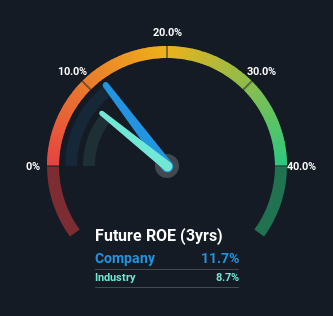
Arguably the easiest way to assess company's ROE is to compare it with the average in its industry. However, this method is only useful as a rough check, because companies do differ quite a bit within the same industry classification. As is clear from the image below, Mainstreet Equity has a better ROE than the average (8.7%) in the Real Estate industry.
That's what we like to see. However, bear in mind that a high ROE doesn’t necessarily indicate efficient profit generation. Especially when a firm uses high levels of debt to finance its debt which may boost its ROE but the high leverage puts the company at risk. To know the 4 risks we have identified for Mainstreet Equity visit our risks dashboard for free.
The Importance Of Debt To Return On Equity
Most companies need money -- from somewhere -- to grow their profits. The cash for investment can come from prior year profits (retained earnings), issuing new shares, or borrowing. In the first two cases, the ROE will capture this use of capital to grow. In the latter case, the debt required for growth will boost returns, but will not impact the shareholders' equity. In this manner the use of debt will boost ROE, even though the core economics of the business stay the same.
Combining Mainstreet Equity's Debt And Its 12% Return On Equity
It's worth noting the high use of debt by Mainstreet Equity, leading to its debt to equity ratio of 1.20. With a fairly low ROE, and significant use of debt, it's hard to get excited about this business at the moment. Debt increases risk and reduces options for the company in the future, so you generally want to see some good returns from using it.
Conclusion
Return on equity is a useful indicator of the ability of a business to generate profits and return them to shareholders. Companies that can achieve high returns on equity without too much debt are generally of good quality. If two companies have around the same level of debt to equity, and one has a higher ROE, I'd generally prefer the one with higher ROE.
Having said that, while ROE is a useful indicator of business quality, you'll have to look at a whole range of factors to determine the right price to buy a stock. It is important to consider other factors, such as future profit growth -- and how much investment is required going forward. So you might want to take a peek at this data-rich interactive graph of forecasts for the company.
If you would prefer check out another company -- one with potentially superior financials -- then do not miss this free list of interesting companies, that have HIGH return on equity and low debt.
Have feedback on this article? Concerned about the content? Get in touch with us directly. Alternatively, email editorial-team (at) simplywallst.com.
This article by Simply Wall St is general in nature. We provide commentary based on historical data and analyst forecasts only using an unbiased methodology and our articles are not intended to be financial advice. It does not constitute a recommendation to buy or sell any stock, and does not take account of your objectives, or your financial situation. We aim to bring you long-term focused analysis driven by fundamental data. Note that our analysis may not factor in the latest price-sensitive company announcements or qualitative material. Simply Wall St has no position in any stocks mentioned.
