
 Yahoo Finance
 Why KLX Energy Services Holdings, Inc.’s (NASDAQ:KLXE) Return On Capital Employed Looks Uninspiring

Today we’ll evaluate KLX Energy Services Holdings, Inc. (NASDAQ:KLXE) to determine whether it could have potential as an investment idea. Specifically, we’ll consider its Return On Capital Employed (ROCE), since that will give us an insight into how efficiently the business can generate profits from the capital it requires.
First of all, we’ll work out how to calculate ROCE. Then we’ll compare its ROCE to similar companies. Then we’ll determine how its current liabilities are affecting its ROCE.
Return On Capital Employed (ROCE): What is it?
ROCE measures the ‘return’ (pre-tax profit) a company generates from capital employed in its business. In general, businesses with a higher ROCE are usually better quality. Ultimately, it is a useful but imperfect metric. Author Edwin Whiting says to be careful when comparing the ROCE of different businesses, since ‘No two businesses are exactly alike.’
How Do You Calculate Return On Capital Employed?
The formula for calculating the return on capital employed is:
Return on Capital Employed = Earnings Before Interest and Tax (EBIT) ÷ (Total Assets – Current Liabilities)
Or for KLX Energy Services Holdings:
0.016 = -US$20.4m ÷ (US$641m – US$69m) (Based on the trailing twelve months to October 2018.)
So, KLX Energy Services Holdings has an ROCE of 1.6%.
Check out our latest analysis for KLX Energy Services Holdings
Want to participate in a short research study? Help shape the future of investing tools and receive a $60 prize!
Does KLX Energy Services Holdings Have A Good ROCE?
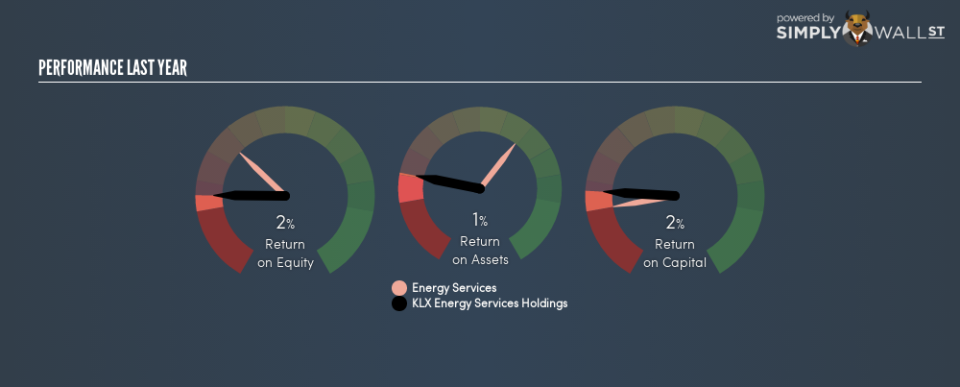
ROCE can be useful when making comparisons, such as between similar companies. Using our data, KLX Energy Services Holdings’s ROCE appears to be significantly below the 6.3% average in the Energy Services industry. This performance is not ideal, as it suggests the company may not be deploying its capital as effectively as some competitors. Putting aside KLX Energy Services Holdings’s performance relative to its industry, its ROCE in absolute terms is poor – considering the risk of owning stocks compared to government bonds. Readers may wish to look for more rewarding investments.
It is important to remember that ROCE shows past performance, and is not necessarily predictive. ROCE can be deceptive for cyclical businesses, as returns can look incredible in boom times, and terribly low in downturns. This is because ROCE only looks at one year, instead of considering returns across a whole cycle. We note KLX Energy Services Holdings could be considered a cyclical business. Future performance is what matters, and you can see analyst predictions in our free report on analyst forecasts for the company.
Do KLX Energy Services Holdings’s Current Liabilities Skew Its ROCE?
Current liabilities are short term bills and invoices that need to be paid in 12 months or less. Due to the way the ROCE equation works, having large bills due in the near term can make it look as though a company has less capital employed, and thus a higher ROCE than usual. To counter this, investors can check if a company has high current liabilities relative to total assets.
KLX Energy Services Holdings has total liabilities of US$69m and total assets of US$641m. As a result, its current liabilities are equal to approximately 11% of its total assets. This is not a high level of current liabilities, which would not boost the ROCE by much.
The Bottom Line On KLX Energy Services Holdings’s ROCE
KLX Energy Services Holdings has a poor ROCE, and there may be better investment prospects out there. Of course, you might find a fantastic investment by looking at a few good candidates. So take a peek at this free list of companies with modest (or no) debt, trading on a P/E below 20.
I will like KLX Energy Services Holdings better if I see some big insider buys. While we wait, check out this free list of growing companies with considerable, recent, insider buying.
To help readers see past the short term volatility of the financial market, we aim to bring you a long-term focused research analysis purely driven by fundamental data. Note that our analysis does not factor in the latest price-sensitive company announcements.
The author is an independent contributor and at the time of publication had no position in the stocks mentioned. For errors that warrant correction please contact the editor at editorial-team@simplywallst.com.
