
 Yahoo Finance
 Why Investors Shouldn't Be Surprised By Workday, Inc.'s (NASDAQ:WDAY) P/S
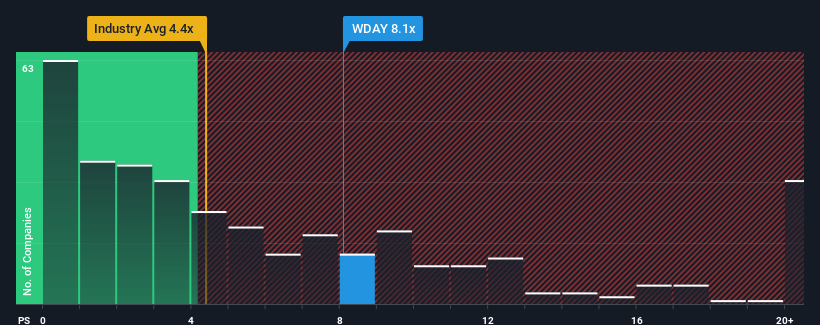
With a price-to-sales (or "P/S") ratio of 8.1x Workday, Inc. (NASDAQ:WDAY) may be sending very bearish signals at the moment, given that almost half of all the Software companies in the United States have P/S ratios under 4.4x and even P/S lower than 1.9x are not unusual. However, the P/S might be quite high for a reason and it requires further investigation to determine if it's justified.
See our latest analysis for Workday
How Has Workday Performed Recently?
Recent times have been advantageous for Workday as its revenues have been rising faster than most other companies. It seems that many are expecting the strong revenue performance to persist, which has raised the P/S. However, if this isn't the case, investors might get caught out paying to much for the stock.
If you'd like to see what analysts are forecasting going forward, you should check out our free report on Workday.
How Is Workday's Revenue Growth Trending?
Workday's P/S ratio would be typical for a company that's expected to deliver very strong growth, and importantly, perform much better than the industry.
Taking a look back first, we see that the company grew revenue by an impressive 21% last year. Pleasingly, revenue has also lifted 71% in aggregate from three years ago, thanks to the last 12 months of growth. Accordingly, shareholders would have definitely welcomed those medium-term rates of revenue growth.
Shifting to the future, estimates from the analysts covering the company suggest revenue should grow by 17% per annum over the next three years. With the industry only predicted to deliver 13% per year, the company is positioned for a stronger revenue result.
With this information, we can see why Workday is trading at such a high P/S compared to the industry. Apparently shareholders aren't keen to offload something that is potentially eyeing a more prosperous future.
What Does Workday's P/S Mean For Investors?
Using the price-to-sales ratio alone to determine if you should sell your stock isn't sensible, however it can be a practical guide to the company's future prospects.
We've established that Workday maintains its high P/S on the strength of its forecasted revenue growth being higher than the the rest of the Software industry, as expected. At this stage investors feel the potential for a deterioration in revenues is quite remote, justifying the elevated P/S ratio. Unless these conditions change, they will continue to provide strong support to the share price.
Plus, you should also learn about these 2 warning signs we've spotted with Workday.
If these risks are making you reconsider your opinion on Workday, explore our interactive list of high quality stocks to get an idea of what else is out there.
Have feedback on this article? Concerned about the content? Get in touch with us directly. Alternatively, email editorial-team (at) simplywallst.com.
This article by Simply Wall St is general in nature. We provide commentary based on historical data and analyst forecasts only using an unbiased methodology and our articles are not intended to be financial advice. It does not constitute a recommendation to buy or sell any stock, and does not take account of your objectives, or your financial situation. We aim to bring you long-term focused analysis driven by fundamental data. Note that our analysis may not factor in the latest price-sensitive company announcements or qualitative material. Simply Wall St has no position in any stocks mentioned.
Join A Paid User Research Session
You’ll receive a US$30 Amazon Gift card for 1 hour of your time while helping us build better investing tools for the individual investors like yourself. Sign up here
