
 Yahoo Finance
 Why Intercontinental Gold and Metals Ltd.’s (CVE:ICAU) Return On Capital Employed Is Impressive

Today we'll evaluate Intercontinental Gold and Metals Ltd. (CVE:ICAU) to determine whether it could have potential as an investment idea. Specifically, we'll consider its Return On Capital Employed (ROCE), since that will give us an insight into how efficiently the business can generate profits from the capital it requires.
Firstly, we'll go over how we calculate ROCE. Next, we'll compare it to others in its industry. And finally, we'll look at how its current liabilities are impacting its ROCE.
Understanding Return On Capital Employed (ROCE)
ROCE is a measure of a company's yearly pre-tax profit (its return), relative to the capital employed in the business. All else being equal, a better business will have a higher ROCE. Ultimately, it is a useful but imperfect metric. Renowned investment researcher Michael Mauboussin has suggested that a high ROCE can indicate that 'one dollar invested in the company generates value of more than one dollar'.
So, How Do We Calculate ROCE?
Analysts use this formula to calculate return on capital employed:
Return on Capital Employed = Earnings Before Interest and Tax (EBIT) ÷ (Total Assets - Current Liabilities)
Or for Intercontinental Gold and Metals:
0.46 = CA$2.0m ÷ (CA$12m - CA$8.2m) (Based on the trailing twelve months to September 2019.)
So, Intercontinental Gold and Metals has an ROCE of 46%.
Check out our latest analysis for Intercontinental Gold and Metals
Does Intercontinental Gold and Metals Have A Good ROCE?
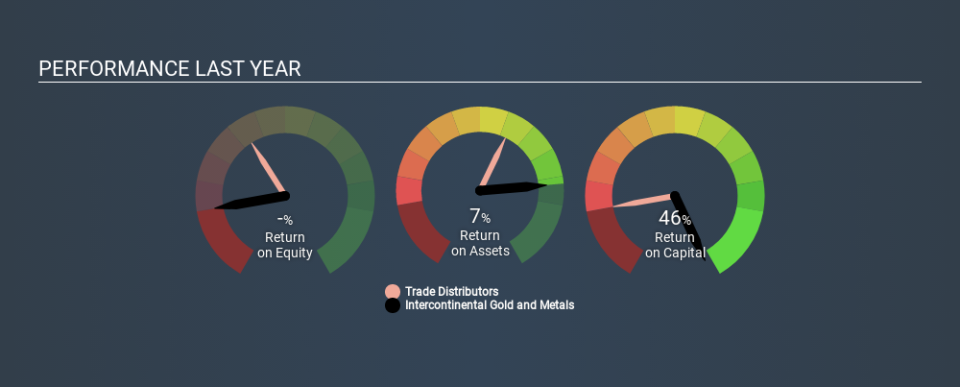
One way to assess ROCE is to compare similar companies. Intercontinental Gold and Metals's ROCE appears to be substantially greater than the 11% average in the Trade Distributors industry. We consider this a positive sign, because it suggests it uses capital more efficiently than similar companies. Setting aside the comparison to its industry for a moment, Intercontinental Gold and Metals's ROCE in absolute terms currently looks quite high.
You can see in the image below how Intercontinental Gold and Metals's ROCE compares to its industry. Click to see more on past growth.
It is important to remember that ROCE shows past performance, and is not necessarily predictive. Companies in cyclical industries can be difficult to understand using ROCE, as returns typically look high during boom times, and low during busts. ROCE is, after all, simply a snap shot of a single year. How cyclical is Intercontinental Gold and Metals? You can see for yourself by looking at this free graph of past earnings, revenue and cash flow.
Intercontinental Gold and Metals's Current Liabilities And Their Impact On Its ROCE
Short term (or current) liabilities, are things like supplier invoices, overdrafts, or tax bills that need to be paid within 12 months. The ROCE equation subtracts current liabilities from capital employed, so a company with a lot of current liabilities appears to have less capital employed, and a higher ROCE than otherwise. To check the impact of this, we calculate if a company has high current liabilities relative to its total assets.
Intercontinental Gold and Metals has total assets of CA$12m and current liabilities of CA$8.2m. As a result, its current liabilities are equal to approximately 66% of its total assets. Intercontinental Gold and Metals's high level of current liabilities boost the ROCE - but its ROCE is still impressive.
Our Take On Intercontinental Gold and Metals's ROCE
So we would be interested in doing more research here -- there may be an opportunity! Intercontinental Gold and Metals looks strong on this analysis, but there are plenty of other companies that could be a good opportunity . Here is a free list of companies growing earnings rapidly.
Intercontinental Gold and Metals is not the only stock insiders are buying. So take a peek at this free list of growing companies with insider buying.
If you spot an error that warrants correction, please contact the editor at editorial-team@simplywallst.com. This article by Simply Wall St is general in nature. It does not constitute a recommendation to buy or sell any stock, and does not take account of your objectives, or your financial situation. Simply Wall St has no position in the stocks mentioned.
We aim to bring you long-term focused research analysis driven by fundamental data. Note that our analysis may not factor in the latest price-sensitive company announcements or qualitative material. Thank you for reading.