
 Yahoo Finance
 Why You Should Like Hillenbrand, Inc.’s (NYSE:HI) ROCE

Today we are going to look at Hillenbrand, Inc. (NYSE:HI) to see whether it might be an attractive investment prospect. Specifically, we'll consider its Return On Capital Employed (ROCE), since that will give us an insight into how efficiently the business can generate profits from the capital it requires.
First, we'll go over how we calculate ROCE. Then we'll compare its ROCE to similar companies. And finally, we'll look at how its current liabilities are impacting its ROCE.
Understanding Return On Capital Employed (ROCE)
ROCE measures the amount of pre-tax profits a company can generate from the capital employed in its business. In general, businesses with a higher ROCE are usually better quality. In brief, it is a useful tool, but it is not without drawbacks. Author Edwin Whiting says to be careful when comparing the ROCE of different businesses, since 'No two businesses are exactly alike.'
So, How Do We Calculate ROCE?
The formula for calculating the return on capital employed is:
Return on Capital Employed = Earnings Before Interest and Tax (EBIT) ÷ (Total Assets - Current Liabilities)
Or for Hillenbrand:
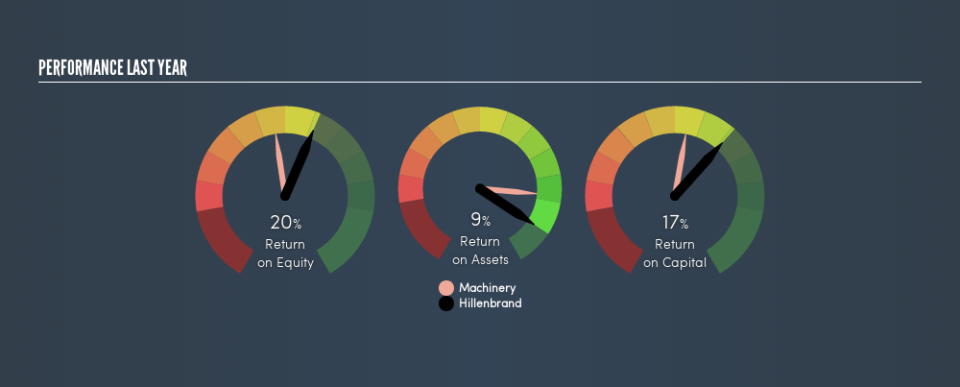
0.17 = US$235m ÷ (US$1.9b - US$506m) (Based on the trailing twelve months to March 2019.)
Therefore, Hillenbrand has an ROCE of 17%.
Check out our latest analysis for Hillenbrand
Does Hillenbrand Have A Good ROCE?
ROCE is commonly used for comparing the performance of similar businesses. In our analysis, Hillenbrand's ROCE is meaningfully higher than the 11% average in the Machinery industry. We consider this a positive sign, because it suggests it uses capital more efficiently than similar companies. Independently of how Hillenbrand compares to its industry, its ROCE in absolute terms appears decent, and the company may be worthy of closer investigation.
In our analysis, Hillenbrand's ROCE appears to be 17%, compared to 3 years ago, when its ROCE was 13%. This makes us think the business might be improving. The image below shows how Hillenbrand's ROCE compares to its industry, and you can click it to see more detail on its past growth.
When considering this metric, keep in mind that it is backwards looking, and not necessarily predictive. ROCE can be misleading for companies in cyclical industries, with returns looking impressive during the boom times, but very weak during the busts. This is because ROCE only looks at one year, instead of considering returns across a whole cycle. Future performance is what matters, and you can see analyst predictions in our free report on analyst forecasts for the company.
What Are Current Liabilities, And How Do They Affect Hillenbrand's ROCE?
Liabilities, such as supplier bills and bank overdrafts, are referred to as current liabilities if they need to be paid within 12 months. The ROCE equation subtracts current liabilities from capital employed, so a company with a lot of current liabilities appears to have less capital employed, and a higher ROCE than otherwise. To counteract this, we check if a company has high current liabilities, relative to its total assets.
Hillenbrand has total assets of US$1.9b and current liabilities of US$506m. Therefore its current liabilities are equivalent to approximately 27% of its total assets. Low current liabilities are not boosting the ROCE too much.
The Bottom Line On Hillenbrand's ROCE
This is good to see, and with a sound ROCE, Hillenbrand could be worth a closer look. There might be better investments than Hillenbrand out there, but you will have to work hard to find them . These promising businesses with rapidly growing earnings might be right up your alley.
For those who like to find winning investments this free list of growing companies with recent insider purchasing, could be just the ticket.
We aim to bring you long-term focused research analysis driven by fundamental data. Note that our analysis may not factor in the latest price-sensitive company announcements or qualitative material.
If you spot an error that warrants correction, please contact the editor at editorial-team@simplywallst.com. This article by Simply Wall St is general in nature. It does not constitute a recommendation to buy or sell any stock, and does not take account of your objectives, or your financial situation. Simply Wall St has no position in the stocks mentioned. Thank you for reading.
