
 Yahoo Finance
 Why EQT Corp. (EQT) Stock Down 6.5% Despite Q1 Earnings Beat
Despite the announcement of better-than-expected first-quarter results on May 7, EQT Corporation EQT has seen a 6.5% decline in share price. The upstream market outlook seems bearish at the moment, thanks to demand destruction caused by coronavirus-induced lockdowns and travel bans. The virus outbreak has decreased domestic natural gas demand by 4-6 billion cubic feet per day.
Better-Than-Expected Q1 Results
EQT Corp. reported first-quarter 2020 adjusted earnings from continuing operations of 14 cents per share compared with the Zacks Consensus Estimate of break-even earnings. In the year-ago comparable period, the company reported adjusted profit of 83 cents per share.
Total operating revenues declined to $1,107.1 million from $1,143.2 million in the prior-year quarter. However, the top line beat the Zacks Consensus Estimate of $941 million.
The better-than-expected results were due to a year-over-year increase in natural gas equivalent production volumes and lower per unit operating expenses, partially offset by reduced commodity price realizations.
EQT Corporation Price, Consensus and EPS Surprise
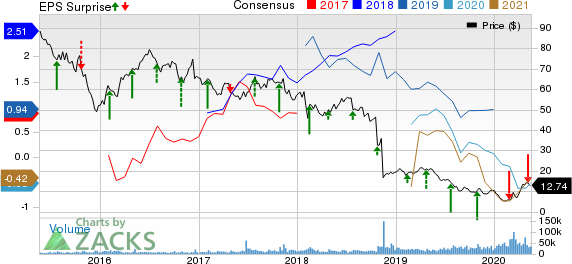
EQT Corporation price-consensus-eps-surprise-chart | EQT Corporation Quote
Operations:
Total Production Increases
Sales volume increased to 385.1 billion cubic feet equivalent (Bcfe) of natural gas from the year-ago figure of 383.5 Bcfe. Natural gas sales volume was 369.7 Bcf for the first quarter, up from 363.7 Bcf a year ago. Total liquids sales volume for the quarter was recorded at 1,803 thousand barrels (MBbls), lower than the year-ago period’s 2,091 MBbls.
Price Realization Decreases
Average realized price was $2.49 per thousand cubic feet of natural gas equivalents (Mcfe), down from $3.16 in the year-ago quarter. Natural gas price was recorded at $2.05 per Mcf, lower than the year-ago level of $3.30. Oil price was recorded at $31.63 per barrel, significantly down from $38.67 in first-quarter 2019. Moreover, ethane sales price was recorded at $4.05 per barrel for the first quarter, lower than the year-ago level of $7.23.
Expenses
Total operating expenses were $1.33 per Mcfe for first-quarter 2020, down from $1.38 in the prior-year quarter.
Processing expenses were 8 cents per Mcfe, in line with the year-ago figure. Gathering expenses fell to 68 cents per Mcfe from 69 cents in first-quarter 2019. However, transmission costs increased to 38 cents per Mcfe from the year-ago level of 37 cents. Lease operating expenses were 7 cents for the quarter, up from 6 cents in the year-ago period.
Overall, total operating expenses amounted to $983.7 million, up from $967.7 million in first-quarter 2019 due to higher impairment charges.
Wells Drilled
The company spud 22 net wells in the first quarter. Of the total, 21 wells were drilled in the PA Marcellus, with the average lateral length being 12,510 feet, and one in the OH Utica, with average lateral length of 14,760 feet.
Cash Flows
EQT Corp.’s adjusted operating cash flow was $512.7 million for the quarter, down from $647.4 million a year ago. However, free cash flow rose to $250.5 million from $171.3 million in first-quarter 2019.
Capex & Balance Sheet
Total capital expenditure amounted to $262.1 million for the first quarter, down from $476 million in the year-ago period.
As of Mar 31, 2020, the company had $18.7 million in cash and cash equivalents, up from the fourth-quarter level of $4.6 million. Total debt of $5,036.9 million declined from the fourth-quarter level of $5,293 million.
Guidance
In 2020, EQT Corp. expects to drill net 75 wells in the PA Marcellus and two in OH Utica. It intends to drill 21 net wells in WV Marcellus in 2020.
The company anticipates total sales volume in the 360-380 Bcfe range for second-quarter 2020. For full-year 2020, it expects total sales volume within 1,450-1,500 Bcfe, indicating a decline from the 2019 level of 1,507 Bcfe.
Total unit costs for 2020 are expected in the range of $1.34-$1.46 per Mcfe. The metric was recorded at $1.44 per Mcfe in 2019.
The company anticipates adjusted operating cash flow in the range of $1.325-$1.425 billion for 2020, suggesting fall from $1.83 billion in 2019. It expects capital expenditure in the band of $1.075-1.175 billion for the year, implying a decrease from $1.77 billion in 2019. As such, free cash flow will likely be recorded within $225-$325 million this year.
Zacks Rank & Other Stocks to Consider
Currently, EQT Corp. has a Zacks Rank #2 (Buy). Other top-ranked players in the energy space include EnLink Midstream LLC ENLC, CNX Resources Corporation CNX and Comstock Resources, Inc. CRK, each holding a Zacks Rank #2. You can see the complete list of today’s Zacks #1 Rank (Strong Buy) stocks here.
EnLink Midstream’s 2020 earnings per share are expected to rise 97.9% year over year.
CNX Resources beat earnings estimates thrice and met once in the last four quarters, with average positive surprise of 111.5%.
Comstock Resources’ 2020 sales are expected to gain 32.7% year over year.
Today's Best Stocks from Zacks
Would you like to see the updated picks from our best market-beating strategies? From 2017 through 2019, while the S&P 500 gained and impressive +53.6%, five of our strategies returned +65.8%, +97.1%, +118.0%, +175.7% and even +186.7%.
This outperformance has not just been a recent phenomenon. From 2000 – 2019, while the S&P averaged +6.0% per year, our top strategies averaged up to +54.7% per year.
See their latest picks free >>
Want the latest recommendations from Zacks Investment Research? Today, you can download 7 Best Stocks for the Next 30 Days. Click to get this free report
Comstock Resources, Inc. (CRK) : Free Stock Analysis Report
EQT Corporation (EQT) : Free Stock Analysis Report
CNX Resources Corporation. (CNX) : Free Stock Analysis Report
EnLink Midstream, LLC (ENLC) : Free Stock Analysis Report
To read this article on Zacks.com click here.
Zacks Investment Research
