
 Yahoo Finance
 Why Emera Incorporated (TSE:EMA) Should Be In Your Portfolio

Want to participate in a short research study? Help shape the future of investing tools and receive a $20 prize!
Over the past 10 years Emera Incorporated (TSE:EMA) has been paying dividends to shareholders. The stock currently pays out a dividend yield of 5.1%, and has a market cap of CA$11b. Should it have a place in your portfolio? Let’s take a look at Emera in more detail.
See our latest analysis for Emera
5 questions I ask before picking a dividend stock
When assessing a stock as a potential addition to my dividend Portfolio, I look at these five areas:
Is its annual yield among the top 25% of dividend-paying companies?
Has its dividend been stable over the past (i.e. no missed payments or significant payout cuts)?
Has dividend per share risen in the past couple of years?
Is is able to pay the current rate of dividends from its earnings?
Will it be able to continue to payout at the current rate in the future?
How does Emera fare?
The current trailing twelve-month payout ratio for the stock is 75%, meaning the dividend is sufficiently covered by earnings. Going forward, analysts expect EMA’s payout to increase to 86% of its earnings. Assuming a constant share price, this equates to a dividend yield of 5.3%. However, EPS is forecasted to fall to CA$2.86 in the upcoming year. Therefore, although payout is expected to increase, the fall in earnings may not equate to higher dividend income.
If you want to dive deeper into the sustainability of a certain payout ratio, you may wish to consider the cash flow of the business. Companies with strong cash flow can sustain a higher payout ratio, while companies with weaker cash flow generally cannot.
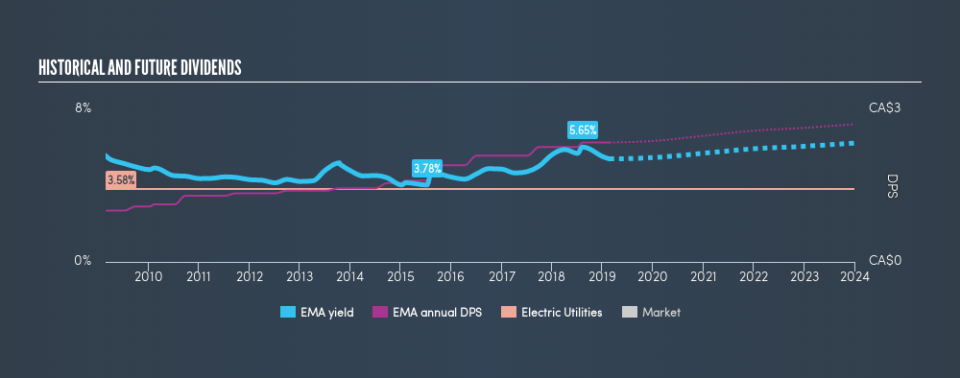
Reliablity is an important factor for dividend stocks, particularly for income investors who want a strong track record of payment and a positive outlook for future payout. EMA has increased its DPS from CA$1.01 to CA$2.35 in the past 10 years. During this period it has not missed a payment, as one would expect for a company increasing its dividend. This is an impressive feat, which makes EMA a true dividend rockstar.
Compared to its peers, Emera generates a yield of 5.1%, which is high for Electric Utilities stocks but still below the market’s top dividend payers.
Next Steps:
With this in mind, I definitely rank Emera as a strong dividend stock, and makes it worth further research for anyone who likes steady income generation from their portfolio. Given that this is purely a dividend analysis, I recommend taking sufficient time to understand its core business and determine whether the company and its investment properties suit your overall goals. There are three essential aspects you should further examine:
Future Outlook: What are well-informed industry analysts predicting for EMA’s future growth? Take a look at our free research report of analyst consensus for EMA’s outlook.
Valuation: What is EMA worth today? Even if the stock is a cash cow, it’s not worth an infinite price. The intrinsic value infographic in our free research report helps visualize whether EMA is currently mispriced by the market.
Other Dividend Rockstars: Are there better dividend payers with stronger fundamentals out there? Check out our free list of these great stocks here.
We aim to bring you long-term focused research analysis driven by fundamental data. Note that our analysis may not factor in the latest price-sensitive company announcements or qualitative material.
If you spot an error that warrants correction, please contact the editor at editorial-team@simplywallst.com. This article by Simply Wall St is general in nature. It does not constitute a recommendation to buy or sell any stock, and does not take account of your objectives, or your financial situation. Simply Wall St has no position in the stocks mentioned. Thank you for reading.
