
 Yahoo Finance
 Why Dorel Industries Inc.'s (TSE:DII.B) CEO Pay Matters To You

Martin Schwartz has been the CEO of Dorel Industries Inc. (TSE:DII.B) since 1992. This analysis aims first to contrast CEO compensation with other companies that have similar market capitalization. After that, we will consider the growth in the business. And finally we will reflect on how common stockholders have fared in the last few years, as a secondary measure of performance. This process should give us an idea about how appropriately the CEO is paid.
View our latest analysis for Dorel Industries
How Does Martin Schwartz's Compensation Compare With Similar Sized Companies?
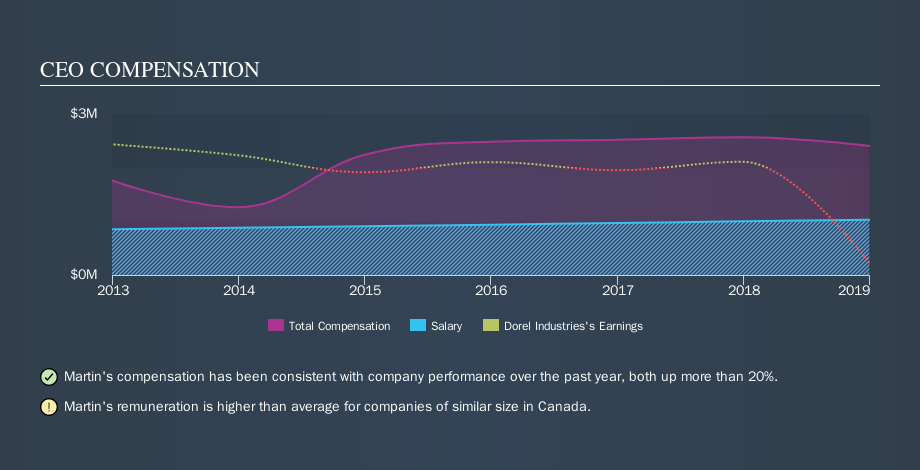
Our data indicates that Dorel Industries Inc. is worth CA$296m, and total annual CEO compensation is US$2.4m. (This figure is for the year to December 2018). While this analysis focuses on total compensation, it's worth noting the salary is lower, valued at US$1.0m. We examined companies with market caps from CA$133m to CA$530m, and discovered that the median CEO total compensation of that group was CA$853k.
Thus we can conclude that Martin Schwartz receives more in total compensation than the median of a group of companies in the same market, and of similar size to Dorel Industries Inc.. However, this doesn't necessarily mean the pay is too high. A closer look at the performance of the underlying business will give us a better idea about whether the pay is particularly generous.
The graphic below shows how CEO compensation at Dorel Industries has changed from year to year.
Is Dorel Industries Inc. Growing?
Over the last three years Dorel Industries Inc. has shrunk its earnings per share by an average of 123% per year (measured with a line of best fit). It achieved revenue growth of 2.5% over the last year.
Unfortunately, earnings per share have trended lower over the last three years. The fairly low revenue growth fails to impress given that the earnings per share is down. It's hard to argue the company is firing on all cylinders, so shareholders might be averse to high CEO remuneration. You might want to check this free visual report on analyst forecasts for future earnings.
Has Dorel Industries Inc. Been A Good Investment?
With a three year total loss of 71%, Dorel Industries Inc. would certainly have some dissatisfied shareholders. This suggests it would be unwise for the company to pay the CEO too generously.
In Summary...
We compared the total CEO remuneration paid by Dorel Industries Inc., and compared it to remuneration at a group of similar sized companies. As discussed above, we discovered that the company pays more than the median of that group.
Neither earnings per share nor revenue have been growing sufficiently fast to impress us, over the last three years.
Over the same period, investors would have come away with nothing in the way of share price gains. This analysis suggests to us that the CEO is paid too generously! If you think CEO compensation levels are interesting you will probably really like this free visualization of insider trading at Dorel Industries.
Of course, you might find a fantastic investment by looking elsewhere. So take a peek at this free list of interesting companies.
We aim to bring you long-term focused research analysis driven by fundamental data. Note that our analysis may not factor in the latest price-sensitive company announcements or qualitative material.
If you spot an error that warrants correction, please contact the editor at editorial-team@simplywallst.com. This article by Simply Wall St is general in nature. It does not constitute a recommendation to buy or sell any stock, and does not take account of your objectives, or your financial situation. Simply Wall St has no position in the stocks mentioned. Thank you for reading.
