
 Yahoo Finance
 Why CSL Limited’s (ASX:CSL) High P/E Ratio Isn’t Necessarily A Bad Thing

The goal of this article is to teach you how to use price to earnings ratios (P/E ratios). We’ll show how you can use CSL Limited’s (ASX:CSL) P/E ratio to inform your assessment of the investment opportunity. CSL has a P/E ratio of 34.69, based on the last twelve months. In other words, at today’s prices, investors are paying A$34.69 for every A$1 in prior year profit.
See our latest analysis for CSL
How Do I Calculate CSL’s Price To Earnings Ratio?
The formula for price to earnings is:
Price to Earnings Ratio = Share Price (in reporting currency) ÷ Earnings per Share (EPS)
Or for CSL:
P/E of 34.69 = $132.59 (Note: this is the share price in the reporting currency, namely, USD ) ÷ $3.82 (Based on the trailing twelve months to June 2018.)
Is A High Price-to-Earnings Ratio Good?
A higher P/E ratio means that buyers have to pay a higher price for each A$1 the company has earned over the last year. That is not a good or a bad thing per se, but a high P/E does imply buyers are optimistic about the future.
How Growth Rates Impact P/E Ratios
Earnings growth rates have a big influence on P/E ratios. When earnings grow, the ‘E’ increases, over time. That means unless the share price increases, the P/E will reduce in a few years. A lower P/E should indicate the stock is cheap relative to others — and that may attract buyers.
It’s nice to see that CSL grew EPS by a stonking 30% in the last year. And its annual EPS growth rate over 5 years is 7.0%. With that performance, I would expect it to have an above average P/E ratio.
How Does CSL’s P/E Ratio Compare To Its Peers?
The P/E ratio essentially measures market expectations of a company. The image below shows that CSL has a higher P/E than the average (24.7) P/E for companies in the biotechs industry.
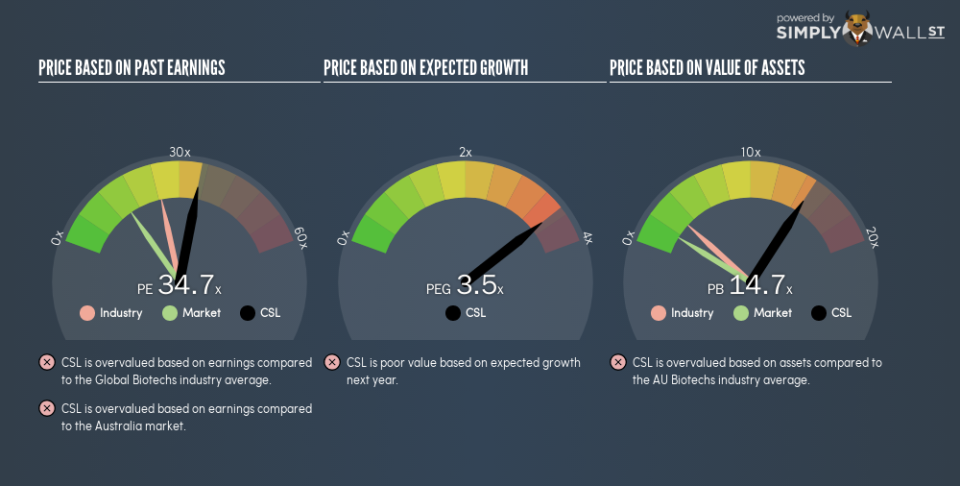
CSL’s P/E tells us that market participants think the company will perform better than its industry peers, going forward. Shareholders are clearly optimistic, but the future is always uncertain. So investors should always consider the P/E ratio alongside other factors, such as whether company directors have been buying shares.
Don’t Forget: The P/E Does Not Account For Debt or Bank Deposits
Don’t forget that the P/E ratio considers market capitalization. Thus, the metric does not reflect cash or debt held by the company. Hypothetically, a company could reduce its future P/E ratio by spending its cash (or taking on debt) to achieve higher earnings.
Such expenditure might be good or bad, in the long term, but the point here is that the balance sheet is not reflected by this ratio.
How Does CSL’s Debt Impact Its P/E Ratio?
Net debt totals just 6.1% of CSL’s market cap. It would probably trade on a higher P/E ratio if it had a lot of cash, but I doubt it is having a big impact.
The Verdict On CSL’s P/E Ratio
CSL trades on a P/E ratio of 34.7, which is above the AU market average of 15.2. While the company does use modest debt, its recent earnings growth is impressive. So it does not seem strange that the P/E is above average.
Investors have an opportunity when market expectations about a stock are wrong. As value investor Benjamin Graham famously said, ‘In the short run, the market is a voting machine but in the long run, it is a weighing machine.’ So this free visual report on analyst forecasts could hold they key to an excellent investment decision.
But note: CSL may not be the best stock to buy. So take a peek at this free list of interesting companies with strong recent earnings growth (and a P/E ratio below 20).
To help readers see past the short term volatility of the financial market, we aim to bring you a long-term focused research analysis purely driven by fundamental data. Note that our analysis does not factor in the latest price-sensitive company announcements.
The author is an independent contributor and at the time of publication had no position in the stocks mentioned. For errors that warrant correction please contact the editor at editorial-team@simplywallst.com.
