
 Yahoo Finance
 Why Clean Harbors, Inc.’s (NYSE:CLH) Return On Capital Employed Might Be A Concern

Today we'll evaluate Clean Harbors, Inc. (NYSE:CLH) to determine whether it could have potential as an investment idea. Specifically, we're going to calculate its Return On Capital Employed (ROCE), in the hopes of getting some insight into the business.
First up, we'll look at what ROCE is and how we calculate it. Second, we'll look at its ROCE compared to similar companies. Then we'll determine how its current liabilities are affecting its ROCE.
Understanding Return On Capital Employed (ROCE)
ROCE is a measure of a company's yearly pre-tax profit (its return), relative to the capital employed in the business. All else being equal, a better business will have a higher ROCE. Overall, it is a valuable metric that has its flaws. Renowned investment researcher Michael Mauboussin has suggested that a high ROCE can indicate that 'one dollar invested in the company generates value of more than one dollar'.
So, How Do We Calculate ROCE?
Analysts use this formula to calculate return on capital employed:
Return on Capital Employed = Earnings Before Interest and Tax (EBIT) ÷ (Total Assets - Current Liabilities)
Or for Clean Harbors:
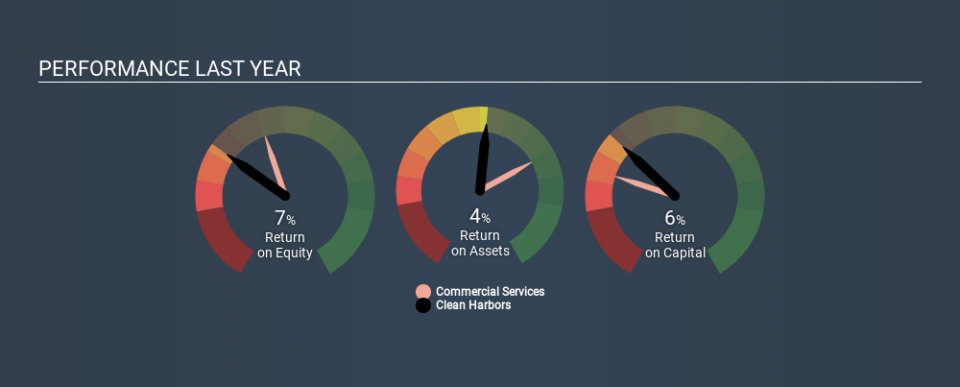
0.064 = US$215m ÷ (US$4.0b - US$680m) (Based on the trailing twelve months to September 2019.)
So, Clean Harbors has an ROCE of 6.4%.
See our latest analysis for Clean Harbors
Is Clean Harbors's ROCE Good?
ROCE can be useful when making comparisons, such as between similar companies. We can see Clean Harbors's ROCE is meaningfully below the Commercial Services industry average of 9.4%. This could be seen as a negative, as it suggests some competitors may be employing their capital more efficiently. Separate from how Clean Harbors stacks up against its industry, its ROCE in absolute terms is mediocre; relative to the returns on government bonds. Readers may find more attractive investment prospects elsewhere.
Our data shows that Clean Harbors currently has an ROCE of 6.4%, compared to its ROCE of 3.4% 3 years ago. This makes us think about whether the company has been reinvesting shrewdly. The image below shows how Clean Harbors's ROCE compares to its industry, and you can click it to see more detail on its past growth.
When considering this metric, keep in mind that it is backwards looking, and not necessarily predictive. ROCE can be deceptive for cyclical businesses, as returns can look incredible in boom times, and terribly low in downturns. ROCE is, after all, simply a snap shot of a single year. Future performance is what matters, and you can see analyst predictions in our free report on analyst forecasts for the company.
What Are Current Liabilities, And How Do They Affect Clean Harbors's ROCE?
Current liabilities include invoices, such as supplier payments, short-term debt, or a tax bill, that need to be paid within 12 months. Due to the way the ROCE equation works, having large bills due in the near term can make it look as though a company has less capital employed, and thus a higher ROCE than usual. To counter this, investors can check if a company has high current liabilities relative to total assets.
Clean Harbors has total liabilities of US$680m and total assets of US$4.0b. As a result, its current liabilities are equal to approximately 17% of its total assets. It is good to see a restrained amount of current liabilities, as this limits the effect on ROCE.
The Bottom Line On Clean Harbors's ROCE
That said, Clean Harbors's ROCE is mediocre, there may be more attractive investments around. Of course, you might also be able to find a better stock than Clean Harbors. So you may wish to see this free collection of other companies that have grown earnings strongly.
For those who like to find winning investments this free list of growing companies with recent insider purchasing, could be just the ticket.
If you spot an error that warrants correction, please contact the editor at editorial-team@simplywallst.com. This article by Simply Wall St is general in nature. It does not constitute a recommendation to buy or sell any stock, and does not take account of your objectives, or your financial situation. Simply Wall St has no position in the stocks mentioned.
We aim to bring you long-term focused research analysis driven by fundamental data. Note that our analysis may not factor in the latest price-sensitive company announcements or qualitative material. Thank you for reading.
