
 Yahoo Finance
 Why You Should Care About SSE plc’s (LON:SSE) Low Return On Capital

Want to participate in a short research study? Help shape the future of investing tools and you could win a $250 gift card!
Today we are going to look at SSE plc (LON:SSE) to see whether it might be an attractive investment prospect. To be precise, we’ll consider its Return On Capital Employed (ROCE), as that will inform our view of the quality of the business.
First, we’ll go over how we calculate ROCE. Then we’ll compare its ROCE to similar companies. Then we’ll determine how its current liabilities are affecting its ROCE.
Understanding Return On Capital Employed (ROCE)
ROCE measures the ‘return’ (pre-tax profit) a company generates from capital employed in its business. Generally speaking a higher ROCE is better. Ultimately, it is a useful but imperfect metric. Renowned investment researcher Michael Mauboussin has suggested that a high ROCE can indicate that ‘one dollar invested in the company generates value of more than one dollar’.
How Do You Calculate Return On Capital Employed?
The formula for calculating the return on capital employed is:
Return on Capital Employed = Earnings Before Interest and Tax (EBIT) ÷ (Total Assets – Current Liabilities)
Or for SSE:
0.044 = UK£1.4b ÷ (UK£25b – UK£8.2b) (Based on the trailing twelve months to September 2018.)
So, SSE has an ROCE of 4.4%.
View our latest analysis for SSE
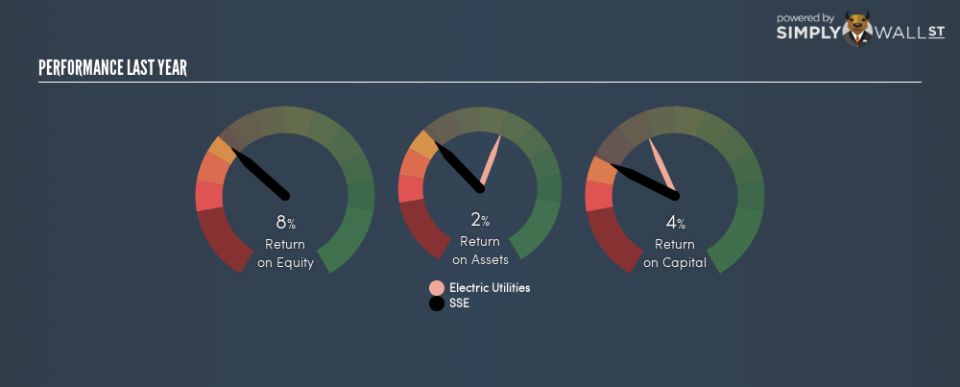
Is SSE’s ROCE Good?
When making comparisons between similar businesses, investors may find ROCE useful. Using our data, SSE’s ROCE appears to be significantly below the 7.7% average in the Electric Utilities industry. This performance could be negative if sustained, as it suggests the business may underperform its industry. Separate from how SSE stacks up against its industry, its ROCE in absolute terms is mediocre; relative to the returns on government bonds. Readers may find more attractive investment prospects elsewhere.
SSE’s current ROCE of 4.4% is lower than its ROCE in the past, which was 9.1%, 3 years ago. This makes us wonder if the business is facing new challenges.
When considering ROCE, bear in mind that it reflects the past and does not necessarily predict the future. ROCE can be misleading for companies in cyclical industries, with returns looking impressive during the boom times, but very weak during the busts. ROCE is, after all, simply a snap shot of a single year. What happens in the future is pretty important for investors, so we have prepared a free report on analyst forecasts for SSE.
What Are Current Liabilities, And How Do They Affect SSE’s ROCE?
Current liabilities include invoices, such as supplier payments, short-term debt, or a tax bill, that need to be paid within 12 months. Due to the way ROCE is calculated, a high level of current liabilities makes a company look as though it has less capital employed, and thus can (sometimes unfairly) boost the ROCE. To counteract this, we check if a company has high current liabilities, relative to its total assets.
SSE has total assets of UK£25b and current liabilities of UK£8.2b. Therefore its current liabilities are equivalent to approximately 33% of its total assets. SSE has a medium level of current liabilities, which would boost its ROCE somewhat.
What We Can Learn From SSE’s ROCE
Unfortunately, its ROCE is still uninspiring, and there are potentially more attractive prospects out there. Of course, you might find a fantastic investment by looking at a few good candidates. So take a peek at this free list of companies with modest (or no) debt, trading on a P/E below 20.
For those who like to find winning investments this free list of growing companies with recent insider purchasing, could be just the ticket.
To help readers see past the short term volatility of the financial market, we aim to bring you a long-term focused research analysis purely driven by fundamental data. Note that our analysis does not factor in the latest price-sensitive company announcements.
The author is an independent contributor and at the time of publication had no position in the stocks mentioned. For errors that warrant correction please contact the editor at editorial-team@simplywallst.com.
