
 Yahoo Finance
 Why You Should Care About Chemed's (NYSE:CHE) Strong Returns On Capital
If you're looking for a multi-bagger, there's a few things to keep an eye out for. In a perfect world, we'd like to see a company investing more capital into its business and ideally the returns earned from that capital are also increasing. Put simply, these types of businesses are compounding machines, meaning they are continually reinvesting their earnings at ever-higher rates of return. With that in mind, the ROCE of Chemed (NYSE:CHE) looks attractive right now, so lets see what the trend of returns can tell us.
Return On Capital Employed (ROCE): What Is It?
For those who don't know, ROCE is a measure of a company's yearly pre-tax profit (its return), relative to the capital employed in the business. Analysts use this formula to calculate it for Chemed:
Return on Capital Employed = Earnings Before Interest and Tax (EBIT) ÷ (Total Assets - Current Liabilities)
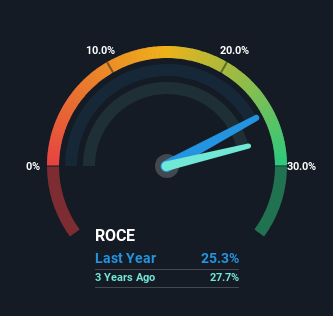
0.25 = US$343m ÷ (US$1.7b - US$312m) (Based on the trailing twelve months to December 2023).
Therefore, Chemed has an ROCE of 25%. That's a fantastic return and not only that, it outpaces the average of 11% earned by companies in a similar industry.
Check out our latest analysis for Chemed
In the above chart we have measured Chemed's prior ROCE against its prior performance, but the future is arguably more important. If you'd like, you can check out the forecasts from the analysts covering Chemed for free.
How Are Returns Trending?
We'd be pretty happy with returns on capital like Chemed. The company has consistently earned 25% for the last five years, and the capital employed within the business has risen 73% in that time. Returns like this are the envy of most businesses and given it has repeatedly reinvested at these rates, that's even better. You'll see this when looking at well operated businesses or favorable business models.
Our Take On Chemed's ROCE
In summary, we're delighted to see that Chemed has been compounding returns by reinvesting at consistently high rates of return, as these are common traits of a multi-bagger. And since the stock has risen strongly over the last five years, it appears the market might expect this trend to continue. So even though the stock might be more "expensive" than it was before, we think the strong fundamentals warrant this stock for further research.
One more thing: We've identified 2 warning signs with Chemed (at least 1 which doesn't sit too well with us) , and understanding them would certainly be useful.
Chemed is not the only stock earning high returns. If you'd like to see more, check out our free list of companies earning high returns on equity with solid fundamentals.
Have feedback on this article? Concerned about the content? Get in touch with us directly. Alternatively, email editorial-team (at) simplywallst.com.
This article by Simply Wall St is general in nature. We provide commentary based on historical data and analyst forecasts only using an unbiased methodology and our articles are not intended to be financial advice. It does not constitute a recommendation to buy or sell any stock, and does not take account of your objectives, or your financial situation. We aim to bring you long-term focused analysis driven by fundamental data. Note that our analysis may not factor in the latest price-sensitive company announcements or qualitative material. Simply Wall St has no position in any stocks mentioned.
