
 Yahoo Finance
 Why Canada Goose Holdings Inc.'s (TSE:GOOS) High P/E Ratio Isn't Necessarily A Bad Thing
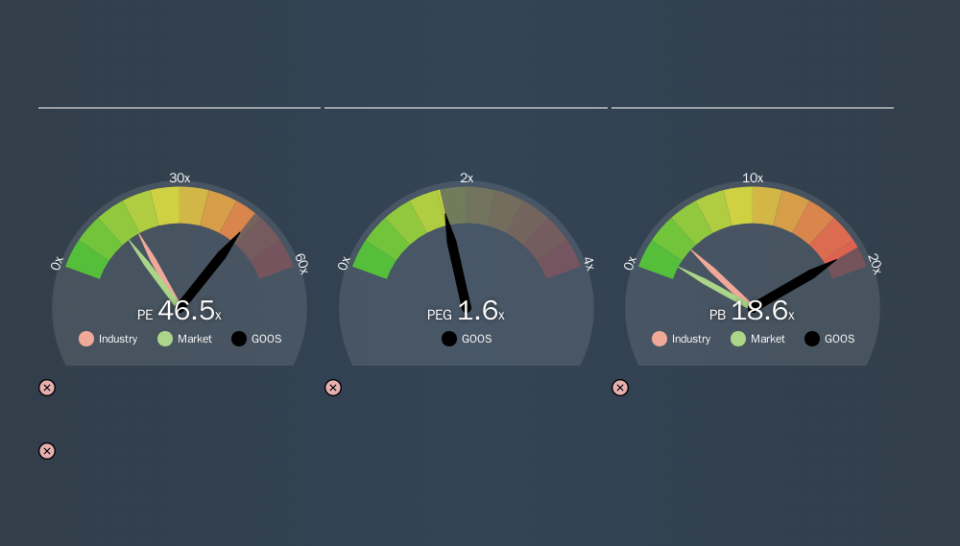
This article is for investors who would like to improve their understanding of price to earnings ratios (P/E ratios). We'll apply a basic P/E ratio analysis to Canada Goose Holdings Inc.'s (TSE:GOOS), to help you decide if the stock is worth further research. What is Canada Goose Holdings's P/E ratio? Well, based on the last twelve months it is 46.54. That is equivalent to an earnings yield of about 2.1%.

Check out our latest analysis for Canada Goose Holdings
How Do I Calculate A Price To Earnings Ratio?
The formula for price to earnings is:
Price to Earnings Ratio = Share Price รท Earnings per Share (EPS)
Or for Canada Goose Holdings:
P/E of 46.54 = CA$56.35 รท CA$1.21 (Based on the year to June 2019.)
Is A High Price-to-Earnings Ratio Good?
A higher P/E ratio means that investors are paying a higher price for each CA$1 of company earnings. That isn't necessarily good or bad, but a high P/E implies relatively high expectations of what a company can achieve in the future.
How Does Canada Goose Holdings's P/E Ratio Compare To Its Peers?
The P/E ratio essentially measures market expectations of a company. As you can see below, Canada Goose Holdings has a higher P/E than the average company (18.5) in the luxury industry.
That means that the market expects Canada Goose Holdings will outperform other companies in its industry. The market is optimistic about the future, but that doesn't guarantee future growth. So investors should delve deeper. I like to check if company insiders have been buying or selling.
How Growth Rates Impact P/E Ratios
Earnings growth rates have a big influence on P/E ratios. Earnings growth means that in the future the 'E' will be higher. That means unless the share price increases, the P/E will reduce in a few years. Then, a lower P/E should attract more buyers, pushing the share price up.
Notably, Canada Goose Holdings grew EPS by a whopping 46% in the last year. And earnings per share have improved by 183% annually, over the last three years. I'd therefore be a little surprised if its P/E ratio was not relatively high.
Don't Forget: The P/E Does Not Account For Debt or Bank Deposits
One drawback of using a P/E ratio is that it considers market capitalization, but not the balance sheet. That means it doesn't take debt or cash into account. Theoretically, a business can improve its earnings (and produce a lower P/E in the future) by investing in growth. That means taking on debt (or spending its cash).
Spending on growth might be good or bad a few years later, but the point is that the P/E ratio does not account for the option (or lack thereof).
So What Does Canada Goose Holdings's Balance Sheet Tell Us?
Net debt totals just 4.6% of Canada Goose Holdings's market cap. The market might award it a higher P/E ratio if it had net cash, but its unlikely this low level of net borrowing is having a big impact on the P/E multiple.
The Verdict On Canada Goose Holdings's P/E Ratio
Canada Goose Holdings's P/E is 46.5 which is way above average (14.3) in its market. The company is not overly constrained by its modest debt levels, and its recent EPS growth is nothing short of stand-out. So to be frank we are not surprised it has a high P/E ratio.
Investors should be looking to buy stocks that the market is wrong about. People often underestimate remarkable growth -- so investors can make money when fast growth is not fully appreciated. So this free report on the analyst consensus forecasts could help you make a master move on this stock.
Of course, you might find a fantastic investment by looking at a few good candidates. So take a peek at this free list of companies with modest (or no) debt, trading on a P/E below 20.
We aim to bring you long-term focused research analysis driven by fundamental data. Note that our analysis may not factor in the latest price-sensitive company announcements or qualitative material.
If you spot an error that warrants correction, please contact the editor at editorial-team@simplywallst.com. This article by Simply Wall St is general in nature. It does not constitute a recommendation to buy or sell any stock, and does not take account of your objectives, or your financial situation. Simply Wall St has no position in the stocks mentioned. Thank you for reading.
