Why Callon (CPE) is Up Nearly 11% Since Q3 Earnings Beat
Shares of Callon Petroleum Company CPE have increased 10.7% since its earnings announcement on Nov 4.
The reasons for the rally were better-than-expected third-quarter results and improved 2019 production guidance. The upstream energy player expects to increase total production in 2019 despite maintaining capital budget.
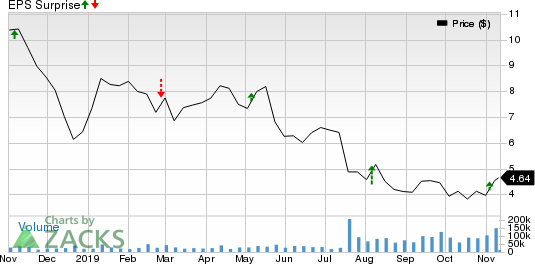
Callon Petroleum Company Price and EPS Surprise

Callon Petroleum Company price-eps-surprise | Callon Petroleum Company Quote
Let’s delve deeper.
Callon reported third-quarter 2019 adjusted earnings of 19 cents per share, beating the Zacks Consensus Estimate of 18 cents. However, the bottom line declined from 21 cents a year ago.
Operating revenues of $155.4 million surpassed the Zacks Consensus Estimate of $153 million but fell from the year-ago quarter’s $161.2 million.
The better-than-expected quarterly results were driven by a surge in oil equivalent production volumes, partially offset by lower price realizations of commodities and higher total operating expenses.
Production Surges
In the quarter, net production volumes averaged 37,837 barrels of oil equivalent per day (Boe/d), reflecting an increase from the year-ago period’s 34,913 Boe/d. The improved volumes were supported by the company’s large-scale development project in the Delaware Basin, which commenced during July-end. Of the total third-quarter production, 78% was oil and the rest comprised natural gas, similar to the year-ago period.
Price Realizations (Without the Impact of Cash-Settled Derivatives) Plunge
The average realized price per barrel of oil equivalent was $44.64. The figure was significantly lower than the year-ago quarter’s $50.19 a barrel. Average realized price for oil was $54.39 per barrel compared with $56.57 a year ago. Moreover, average realized price for natural gas came in at $1.58 per thousand cubic feet, down from $4.49 in the prior-year quarter.
Total Expenses Increase
Total operating expenses in the quarter amounted to $102.8 million, higher than the year-ago level of $88.4 million. However, lease operating expenses were recorded at $5.65 per Boe in the quarter under review compared with $5.77 a year ago.
Capital Expenditure & Balance Sheet
Capital expenditure in the reported quarter was almost $144 million, lower than the year-ago figure of $157 million.
As of Sep 30, 2019, the company’s total cash and cash equivalents amounted to $11.3 million, and debt was $1.2 billion, with a debt-to-capitalization ratio of 32.5%.
Revised Guidance
For 2019, Callon’s production guidance is upwardly revised to the range of 39.2-39.6 thousand barrels of oil equivalent per day (Mboe/d) from 38-39.5 Mboe/d, of which 78% is expected to be oil.
Operational capital expenditure guidance for 2019 is reiterated in the range of $495-$520 million.
Net operated horizontal wells to be placed on production in 2019 are expected between 48 and 50, lower than the 2018 level of 54.
The company expects lease operating expenses in the range of $5.75-$6.25 per Boe in 2019.
Zacks Rank and Stocks to Consider
Currently, Callon has a Zacks Rank #3 (Hold). Some better-ranked players in the energy space are Lonestar Resources US Inc. LONE, CNX Resources Corporation CNX and Contango Oil & Gas Company MCF. All these companies carry a Zacks Rank #2 (Buy). You can see the complete list of today’s Zacks #1 Rank (Strong Buy) stocks here.
Lonestar’s 2020 earnings per share are expected to rise 77% year over year.
CNX Resources’ 2019 earnings per share have witnessed two upward movements and no downward revision in the past 30 days.
Contango Oil & Gas’ bottom line for the current year is expected to rise around 87% year over year.
Looking for Stocks with Skyrocketing Upside?
Zacks has just released a Special Report on the booming investment opportunities of legal marijuana.
Ignited by new referendums and legislation, this industry is expected to blast from an already robust $6.7 billion to $20.2 billion in 2021. Early investors stand to make a killing, but you have to be ready to act and know just where to look.
See the pot trades we're targeting>>
Want the latest recommendations from Zacks Investment Research? Today, you can download 7 Best Stocks for the Next 30 Days. Click to get this free report
CNX Resources Corporation. (CNX) : Free Stock Analysis Report
Lonestar Resources US Inc. (LONE) : Free Stock Analysis Report
Contango Oil & Gas Company (MCF) : Free Stock Analysis Report
Callon Petroleum Company (CPE) : Free Stock Analysis Report
To read this article on Zacks.com click here.
Zacks Investment Research

 Yahoo Finance