
 Yahoo Finance
 Why Baker Hughes Company's (NYSE:BKR) High P/E Ratio Isn't Necessarily A Bad Thing

This article is for investors who would like to improve their understanding of price to earnings ratios (P/E ratios). To keep it practical, we'll show how Baker Hughes Company's (NYSE:BKR) P/E ratio could help you assess the value on offer. Baker Hughes has a P/E ratio of 61.28, based on the last twelve months. In other words, at today's prices, investors are paying $61.28 for every $1 in prior year profit.
Check out our latest analysis for Baker Hughes
How Do You Calculate Baker Hughes's P/E Ratio?
The formula for price to earnings is:
Price to Earnings Ratio = Price per Share ÷ Earnings per Share (EPS)
Or for Baker Hughes:
P/E of 61.28 = $25.49 ÷ $0.42 (Based on the trailing twelve months to September 2019.)
Is A High Price-to-Earnings Ratio Good?
The higher the P/E ratio, the higher the price tag of a business, relative to its trailing earnings. That is not a good or a bad thing per se, but a high P/E does imply buyers are optimistic about the future.
Does Baker Hughes Have A Relatively High Or Low P/E For Its Industry?
The P/E ratio essentially measures market expectations of a company. You can see in the image below that the average P/E (15.8) for companies in the energy services industry is a lot lower than Baker Hughes's P/E.
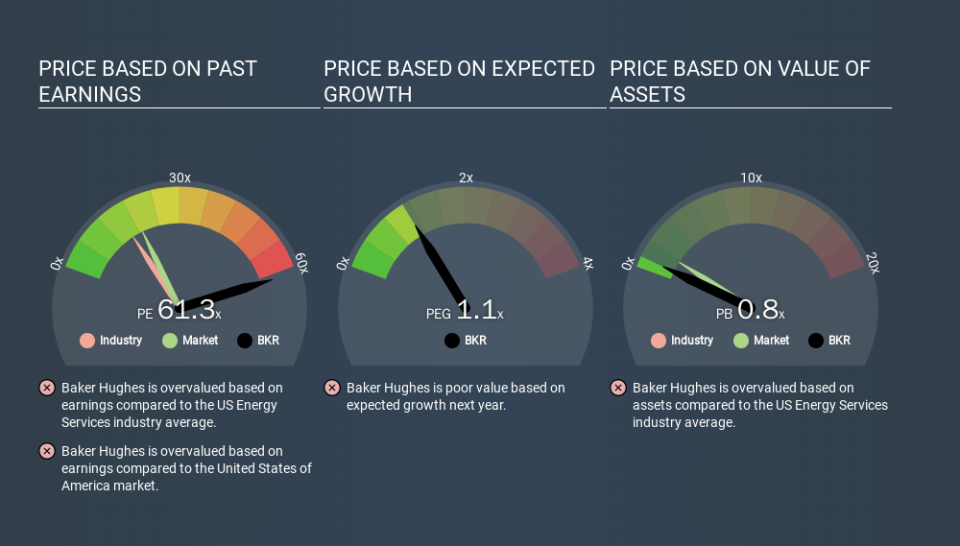
Baker Hughes's P/E tells us that market participants think the company will perform better than its industry peers, going forward. Shareholders are clearly optimistic, but the future is always uncertain. So investors should always consider the P/E ratio alongside other factors, such as whether company directors have been buying shares.
How Growth Rates Impact P/E Ratios
P/E ratios primarily reflect market expectations around earnings growth rates. When earnings grow, the 'E' increases, over time. Therefore, even if you pay a high multiple of earnings now, that multiple will become lower in the future. A lower P/E should indicate the stock is cheap relative to others -- and that may attract buyers.
In the last year, Baker Hughes grew EPS like Taylor Swift grew her fan base back in 2010; the 83% gain was both fast and well deserved.
Don't Forget: The P/E Does Not Account For Debt or Bank Deposits
One drawback of using a P/E ratio is that it considers market capitalization, but not the balance sheet. So it won't reflect the advantage of cash, or disadvantage of debt. Hypothetically, a company could reduce its future P/E ratio by spending its cash (or taking on debt) to achieve higher earnings.
Such spending might be good or bad, overall, but the key point here is that you need to look at debt to understand the P/E ratio in context.
Is Debt Impacting Baker Hughes's P/E?
Baker Hughes has net debt worth 16% of its market capitalization. That's enough debt to impact the P/E ratio a little; so keep it in mind if you're comparing it to companies without debt.
The Verdict On Baker Hughes's P/E Ratio
Baker Hughes's P/E is 61.3 which suggests the market is more focussed on the future opportunity rather than the current level of earnings. While the company does use modest debt, its recent earnings growth is superb. So on this analysis a high P/E ratio seems reasonable.
Investors should be looking to buy stocks that the market is wrong about. People often underestimate remarkable growth -- so investors can make money when fast growth is not fully appreciated. So this free visual report on analyst forecasts could hold the key to an excellent investment decision.
Of course you might be able to find a better stock than Baker Hughes. So you may wish to see this free collection of other companies that have grown earnings strongly.
If you spot an error that warrants correction, please contact the editor at editorial-team@simplywallst.com. This article by Simply Wall St is general in nature. It does not constitute a recommendation to buy or sell any stock, and does not take account of your objectives, or your financial situation. Simply Wall St has no position in the stocks mentioned.
We aim to bring you long-term focused research analysis driven by fundamental data. Note that our analysis may not factor in the latest price-sensitive company announcements or qualitative material. Thank you for reading.
