
 Yahoo Finance
 Why The 41% Return On Capital At mobilezone holding ag (VTX:MOZN) Should Have Your Attention
If we want to find a potential multi-bagger, often there are underlying trends that can provide clues. One common approach is to try and find a company with returns on capital employed (ROCE) that are increasing, in conjunction with a growing amount of capital employed. Ultimately, this demonstrates that it's a business that is reinvesting profits at increasing rates of return. Speaking of which, we noticed some great changes in mobilezone holding ag's (VTX:MOZN) returns on capital, so let's have a look.
What Is Return On Capital Employed (ROCE)?
If you haven't worked with ROCE before, it measures the 'return' (pre-tax profit) a company generates from capital employed in its business. To calculate this metric for mobilezone holding ag, this is the formula:
Return on Capital Employed = Earnings Before Interest and Tax (EBIT) ÷ (Total Assets - Current Liabilities)
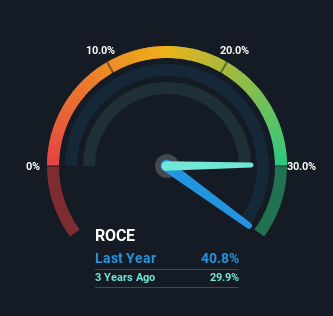
0.41 = CHF66m ÷ (CHF358m - CHF197m) (Based on the trailing twelve months to December 2023).
Therefore, mobilezone holding ag has an ROCE of 41%. That's a fantastic return and not only that, it outpaces the average of 11% earned by companies in a similar industry.
Check out our latest analysis for mobilezone holding ag
Above you can see how the current ROCE for mobilezone holding ag compares to its prior returns on capital, but there's only so much you can tell from the past. If you'd like to see what analysts are forecasting going forward, you should check out our free analyst report for mobilezone holding ag .
What Can We Tell From mobilezone holding ag's ROCE Trend?
mobilezone holding ag is showing promise given that its ROCE is trending up and to the right. The figures show that over the last five years, ROCE has grown 38% whilst employing roughly the same amount of capital. So our take on this is that the business has increased efficiencies to generate these higher returns, all the while not needing to make any additional investments. On that front, things are looking good so it's worth exploring what management has said about growth plans going forward.
On a separate but related note, it's important to know that mobilezone holding ag has a current liabilities to total assets ratio of 55%, which we'd consider pretty high. This effectively means that suppliers (or short-term creditors) are funding a large portion of the business, so just be aware that this can introduce some elements of risk. While it's not necessarily a bad thing, it can be beneficial if this ratio is lower.
What We Can Learn From mobilezone holding ag's ROCE
To sum it up, mobilezone holding ag is collecting higher returns from the same amount of capital, and that's impressive. And investors seem to expect more of this going forward, since the stock has rewarded shareholders with a 93% return over the last five years. In light of that, we think it's worth looking further into this stock because if mobilezone holding ag can keep these trends up, it could have a bright future ahead.
mobilezone holding ag does have some risks, we noticed 3 warning signs (and 2 which make us uncomfortable) we think you should know about.
If you want to search for more stocks that have been earning high returns, check out this free list of stocks with solid balance sheets that are also earning high returns on equity.
Have feedback on this article? Concerned about the content? Get in touch with us directly. Alternatively, email editorial-team (at) simplywallst.com.
This article by Simply Wall St is general in nature. We provide commentary based on historical data and analyst forecasts only using an unbiased methodology and our articles are not intended to be financial advice. It does not constitute a recommendation to buy or sell any stock, and does not take account of your objectives, or your financial situation. We aim to bring you long-term focused analysis driven by fundamental data. Note that our analysis may not factor in the latest price-sensitive company announcements or qualitative material. Simply Wall St has no position in any stocks mentioned.
