
 Yahoo Finance
 Where Quizam Media Corporation (CVE:QQ) Stands In Earnings Growth Against Its Industry

In this commentary, I will examine Quizam Media Corporation’s (TSXV:QQ) latest earnings update (28 February 2018) and compare these figures against its performance over the past couple of years, as well as how the rest of the consumer services industry performed. As an investor, I find it beneficial to assess QQ’s trend over the short-to-medium term in order to gauge whether or not the company is able to meet its goals, and ultimately sustainably grow over time. See our latest analysis for Quizam Media
How QQ fared against its long-term earnings performance and its industry
I prefer to use the ‘latest twelve-month’ data, which either annualizes the most recent 6-month earnings update, or in some cases, the most recent annual report is already the latest available financial data. This technique allows me to assess different companies in a uniform manner using the most relevant data points. For Quizam Media, its most recent bottom-line (trailing twelve month) is -CA$1.04M, which, against the previous year’s level, has become less negative. Since these values may be fairly short-term, I’ve calculated an annualized five-year figure for Quizam Media’s earnings, which stands at -CA$1.37M. This means that, while net income is negative, it has become less negative over the years.
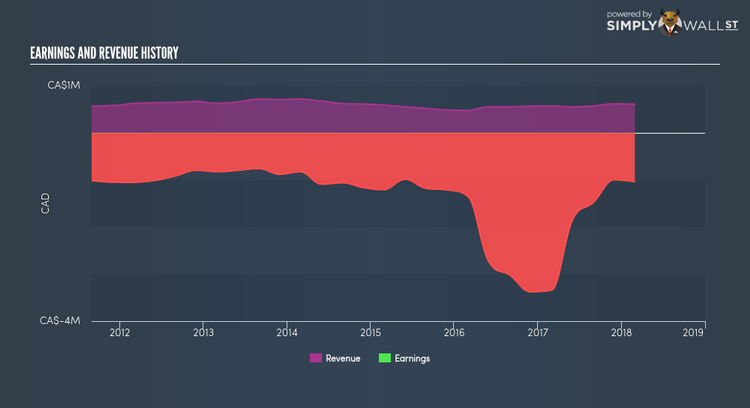
We can further evaluate Quizam Media’s loss by looking at what the industry has been experiencing over the past few years. Each year, for the past five years Quizam Media has seen an annual decline in revenue of -2.49%, on average. This adverse movement is a driver of the company’s inability to reach breakeven. Has the entire industry experienced this headwind? Looking at growth from a sector-level, the Canadian consumer services industry has been enduring some headwinds over the previous year, leading to an average earnings drop of -22.17%. This is a significant change, given that the industry has constantly been delivering a a solid growth of 32.46% in the past half a decade. This means that despite the fact that Quizam Media is presently loss-making, any near-term headwind the industry is experiencing, Quizam Media is less exposed compared to its peers.
What does this mean?
Quizam Media’s track record can be a valuable insight into its earnings performance, but it certainly doesn’t tell the whole story. Companies that incur net loss is always hard to predict what will occur going forward, and when. The most useful step is to examine company-specific issues Quizam Media may be facing and whether management guidance has steadily been met in the past. I suggest you continue to research Quizam Media to get a more holistic view of the stock by looking at:
Financial Health: Is QQ’s operations financially sustainable? Balance sheets can be hard to analyze, which is why we’ve done it for you. Check out our financial health checks here.
Other High-Performing Stocks: Are there other stocks that provide better prospects with proven track records? Explore our free list of these great stocks here.
NB: Figures in this article are calculated using data from the trailing twelve months from 28 February 2018. This may not be consistent with full year annual report figures.
To help readers see pass the short term volatility of the financial market, we aim to bring you a long-term focused research analysis purely driven by fundamental data. Note that our analysis does not factor in the latest price sensitive company announcements.
The author is an independent contributor and at the time of publication had no position in the stocks mentioned.
