
 Yahoo Finance
 Westwing Group SE's (ETR:WEW) P/S Still Appears To Be Reasonable
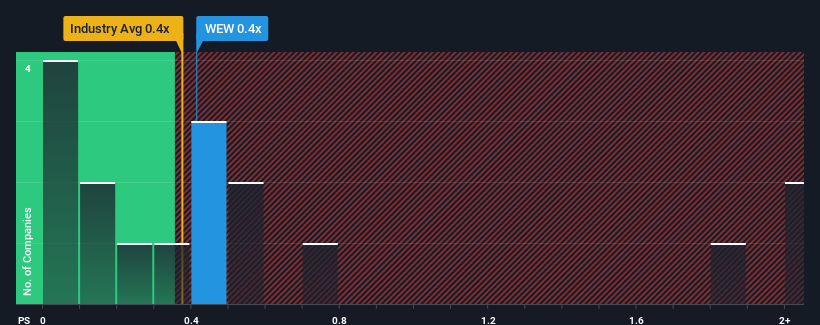
It's not a stretch to say that Westwing Group SE's (ETR:WEW) price-to-sales (or "P/S") ratio of 0.4x seems quite "middle-of-the-road" for Specialty Retail companies in Germany, seeing as it matches the P/S ratio of the wider industry. However, investors might be overlooking a clear opportunity or potential setback if there is no rational basis for the P/S.
View our latest analysis for Westwing Group
What Does Westwing Group's P/S Mean For Shareholders?
Westwing Group hasn't been tracking well recently as its declining revenue compares poorly to other companies, which have seen some growth in their revenues on average. One possibility is that the P/S ratio is moderate because investors think this poor revenue performance will turn around. If not, then existing shareholders may be a little nervous about the viability of the share price.
Want the full picture on analyst estimates for the company? Then our free report on Westwing Group will help you uncover what's on the horizon.
What Are Revenue Growth Metrics Telling Us About The P/S?
The only time you'd be comfortable seeing a P/S like Westwing Group's is when the company's growth is tracking the industry closely.
In reviewing the last year of financials, we were disheartened to see the company's revenues fell to the tune of 15%. Even so, admirably revenue has lifted 55% in aggregate from three years ago, notwithstanding the last 12 months. Although it's been a bumpy ride, it's still fair to say the revenue growth recently has been more than adequate for the company.
Shifting to the future, estimates from the three analysts covering the company suggest revenue should grow by 7.1% per year over the next three years. Meanwhile, the rest of the industry is forecast to expand by 6.1% each year, which is not materially different.
With this information, we can see why Westwing Group is trading at a fairly similar P/S to the industry. It seems most investors are expecting to see average future growth and are only willing to pay a moderate amount for the stock.
What We Can Learn From Westwing Group's P/S?
Typically, we'd caution against reading too much into price-to-sales ratios when settling on investment decisions, though it can reveal plenty about what other market participants think about the company.
A Westwing Group's P/S seems about right to us given the knowledge that analysts are forecasting a revenue outlook that is similar to the Specialty Retail industry. At this stage investors feel the potential for an improvement or deterioration in revenue isn't great enough to push P/S in a higher or lower direction. If all things remain constant, the possibility of a drastic share price movement remains fairly remote.
The company's balance sheet is another key area for risk analysis. Our free balance sheet analysis for Westwing Group with six simple checks will allow you to discover any risks that could be an issue.
Of course, profitable companies with a history of great earnings growth are generally safer bets. So you may wish to see this free collection of other companies that have reasonable P/E ratios and have grown earnings strongly.
Have feedback on this article? Concerned about the content? Get in touch with us directly. Alternatively, email editorial-team (at) simplywallst.com.
This article by Simply Wall St is general in nature. We provide commentary based on historical data and analyst forecasts only using an unbiased methodology and our articles are not intended to be financial advice. It does not constitute a recommendation to buy or sell any stock, and does not take account of your objectives, or your financial situation. We aim to bring you long-term focused analysis driven by fundamental data. Note that our analysis may not factor in the latest price-sensitive company announcements or qualitative material. Simply Wall St has no position in any stocks mentioned.
