
 Yahoo Finance
 Western Energy Services (TSE:WRG) Might Have The Makings Of A Multi-Bagger
If we want to find a stock that could multiply over the long term, what are the underlying trends we should look for? Typically, we'll want to notice a trend of growing return on capital employed (ROCE) and alongside that, an expanding base of capital employed. Basically this means that a company has profitable initiatives that it can continue to reinvest in, which is a trait of a compounding machine. Speaking of which, we noticed some great changes in Western Energy Services' (TSE:WRG) returns on capital, so let's have a look.
Return On Capital Employed (ROCE): What Is It?
For those who don't know, ROCE is a measure of a company's yearly pre-tax profit (its return), relative to the capital employed in the business. The formula for this calculation on Western Energy Services is:
Return on Capital Employed = Earnings Before Interest and Tax (EBIT) ÷ (Total Assets - Current Liabilities)
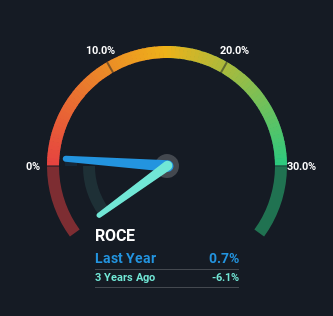
0.0068 = CA$2.8m ÷ (CA$443m - CA$31m) (Based on the trailing twelve months to December 2023).
So, Western Energy Services has an ROCE of 0.7%. Ultimately, that's a low return and it under-performs the Energy Services industry average of 14%.
Check out our latest analysis for Western Energy Services
In the above chart we have measured Western Energy Services' prior ROCE against its prior performance, but the future is arguably more important. If you're interested, you can view the analysts predictions in our free analyst report for Western Energy Services .
What Can We Tell From Western Energy Services' ROCE Trend?
We're delighted to see that Western Energy Services is reaping rewards from its investments and has now broken into profitability. While the business is profitable now, it used to be incurring losses on invested capital five years ago. In regards to capital employed, Western Energy Services is using 35% less capital than it was five years ago, which on the surface, can indicate that the business has become more efficient at generating these returns. This could potentially mean that the company is selling some of its assets.
What We Can Learn From Western Energy Services' ROCE
From what we've seen above, Western Energy Services has managed to increase it's returns on capital all the while reducing it's capital base. Although the company may be facing some issues elsewhere since the stock has plunged 93% in the last five years. Still, it's worth doing some further research to see if the trends will continue into the future.
If you'd like to know about the risks facing Western Energy Services, we've discovered 1 warning sign that you should be aware of.
For those who like to invest in solid companies, check out this free list of companies with solid balance sheets and high returns on equity.
Have feedback on this article? Concerned about the content? Get in touch with us directly. Alternatively, email editorial-team (at) simplywallst.com.
This article by Simply Wall St is general in nature. We provide commentary based on historical data and analyst forecasts only using an unbiased methodology and our articles are not intended to be financial advice. It does not constitute a recommendation to buy or sell any stock, and does not take account of your objectives, or your financial situation. We aim to bring you long-term focused analysis driven by fundamental data. Note that our analysis may not factor in the latest price-sensitive company announcements or qualitative material. Simply Wall St has no position in any stocks mentioned.
