
 Yahoo Finance
 We're Not Worried About C3 Metals' (CVE:CCCM) Cash Burn
Even when a business is losing money, it's possible for shareholders to make money if they buy a good business at the right price. By way of example, C3 Metals (CVE:CCCM) has seen its share price rise 146% over the last year, delighting many shareholders. Having said that, unprofitable companies are risky because they could potentially burn through all their cash and become distressed.
So notwithstanding the buoyant share price, we think it's well worth asking whether C3 Metals' cash burn is too risky. For the purpose of this article, we'll define cash burn as the amount of cash the company is spending each year to fund its growth (also called its negative free cash flow). The first step is to compare its cash burn with its cash reserves, to give us its 'cash runway'.
Check out our latest analysis for C3 Metals
Does C3 Metals Have A Long Cash Runway?
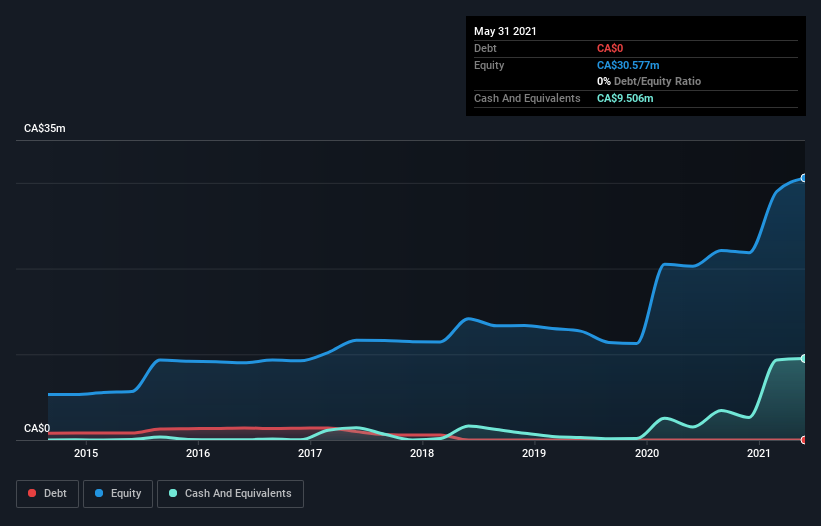
A company's cash runway is the amount of time it would take to burn through its cash reserves at its current cash burn rate. In May 2021, C3 Metals had CA$9.5m in cash, and was debt-free. Importantly, its cash burn was CA$2.0m over the trailing twelve months. So it had a cash runway of about 4.8 years from May 2021. There's no doubt that this is a reassuringly long runway. You can see how its cash balance has changed over time in the image below.
How Is C3 Metals' Cash Burn Changing Over Time?
Because C3 Metals isn't currently generating revenue, we consider it an early-stage business. Nonetheless, we can still examine its cash burn trajectory as part of our assessment of its cash burn situation. Over the last year its cash burn actually increased by 31%, which suggests that management are increasing investment in future growth, but not too quickly. However, the company's true cash runway will therefore be shorter than suggested above, if spending continues to increase. While the past is always worth studying, it is the future that matters most of all. So you might want to take a peek at how much the company is expected to grow in the next few years.
How Hard Would It Be For C3 Metals To Raise More Cash For Growth?
Given its cash burn trajectory, C3 Metals shareholders may wish to consider how easily it could raise more cash, despite its solid cash runway. Generally speaking, a listed business can raise new cash through issuing shares or taking on debt. Many companies end up issuing new shares to fund future growth. We can compare a company's cash burn to its market capitalisation to get a sense for how many new shares a company would have to issue to fund one year's operations.
Since it has a market capitalisation of CA$74m, C3 Metals' CA$2.0m in cash burn equates to about 2.7% of its market value. That means it could easily issue a few shares to fund more growth, and might well be in a position to borrow cheaply.
Is C3 Metals' Cash Burn A Worry?
It may already be apparent to you that we're relatively comfortable with the way C3 Metals is burning through its cash. For example, we think its cash runway suggests that the company is on a good path. Although its increasing cash burn does give us reason for pause, the other metrics we discussed in this article form a positive picture overall. Looking at all the measures in this article, together, we're not worried about its rate of cash burn; the company seems well on top of its medium-term spending needs. Separately, we looked at different risks affecting the company and spotted 4 warning signs for C3 Metals (of which 1 is a bit concerning!) you should know about.
Of course C3 Metals may not be the best stock to buy. So you may wish to see this free collection of companies boasting high return on equity, or this list of stocks that insiders are buying.
This article by Simply Wall St is general in nature. We provide commentary based on historical data and analyst forecasts only using an unbiased methodology and our articles are not intended to be financial advice. It does not constitute a recommendation to buy or sell any stock, and does not take account of your objectives, or your financial situation. We aim to bring you long-term focused analysis driven by fundamental data. Note that our analysis may not factor in the latest price-sensitive company announcements or qualitative material. Simply Wall St has no position in any stocks mentioned.
Have feedback on this article? Concerned about the content? Get in touch with us directly. Alternatively, email editorial-team (at) simplywallst.com.
