
 Yahoo Finance
 We're A Little Worried About PowerOre's (CVE:PORE) Cash Burn Rate

Even when a business is losing money, it's possible for shareholders to make money if they buy a good business at the right price. For example, although software-as-a-service business Salesforce.com lost money for years while it grew recurring revenue, if you held shares since 2005, you'd have done very well indeed. But while history lauds those rare successes, those that fail are often forgotten; who remembers Pets.com?
So, the natural question for PowerOre (CVE:PORE) shareholders is whether they should be concerned by its rate of cash burn. In this report, we will consider the company's annual negative free cash flow, henceforth referring to it as the 'cash burn'. Let's start with an examination of the business's cash, relative to its cash burn.
Check out our latest analysis for PowerOre
Does PowerOre Have A Long Cash Runway?
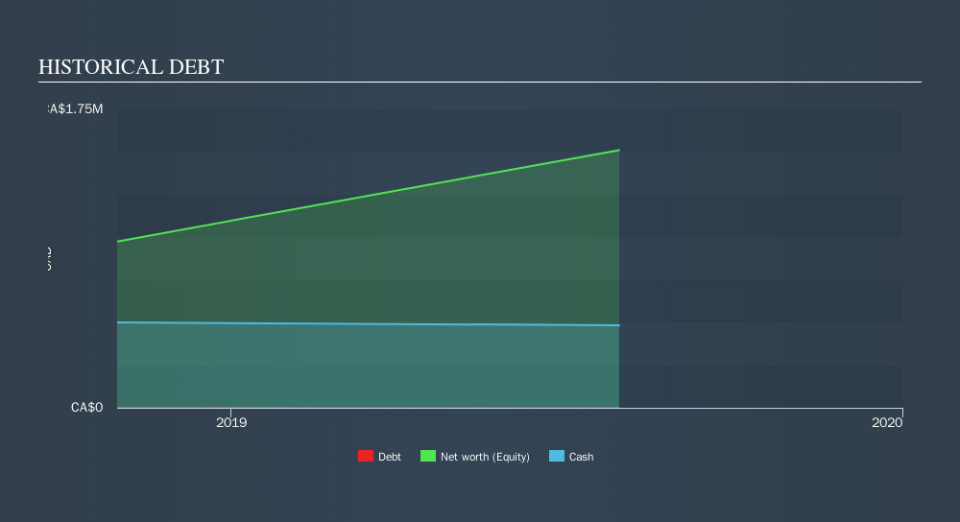
A cash runway is defined as the length of time it would take a company to run out of money if it kept spending at its current rate of cash burn. When PowerOre last reported its balance sheet in July 2019, it had zero debt and cash worth CA$484k. In the last year, its cash burn was CA$1.3m. So it had a cash runway of approximately 4 months from July 2019. With a cash runway that short, we strongly believe that the company must raise cash or else douse its cash burn promptly. The image below shows how its cash balance has been changing over the last few years.
How Hard Would It Be For PowerOre To Raise More Cash For Growth?
Issuing new shares, or taking on debt, are the most common ways for a listed company to raise more money for its business. Commonly, a business will sell new shares in itself to raise cash to drive growth. By looking at a company's cash burn relative to its market capitalisation, we gain insight on how much shareholders would be diluted if the company needed to raise enough cash to cover another year's cash burn.
PowerOre has a market capitalisation of CA$2.4m and burnt through CA$1.3m last year, which is 56% of the company's market value. From this perspective, it seems that the company spent a hugh amount relative to its market value, and we'd be very wary of a painful capital raising.
So, Should We Worry About PowerOre's Cash Burn?
Given it's an early stage company, we don't have a lot of data with which to judge PowerOre's cash burn. However, it is fair to say that its cash runway made us nervous. Overall, we're left with the impression that it may have trouble maintaining its cash burn and with uncertainty around the pay off, we'd probably try to avoid the stock. When you don't have traditional metrics like earnings per share and free cash flow to value a company, many are extra motivated to consider qualitative factors such as whether insiders are buying or selling shares. Please Note: PowerOre insiders have been trading shares, according to our data. Click here to check whether insiders have been buying or selling.
Of course PowerOre may not be the best stock to buy. So you may wish to see this free collection of companies boasting high return on equity, or this list of stocks that insiders are buying.
We aim to bring you long-term focused research analysis driven by fundamental data. Note that our analysis may not factor in the latest price-sensitive company announcements or qualitative material.
If you spot an error that warrants correction, please contact the editor at editorial-team@simplywallst.com. This article by Simply Wall St is general in nature. It does not constitute a recommendation to buy or sell any stock, and does not take account of your objectives, or your financial situation. Simply Wall St has no position in the stocks mentioned. Thank you for reading.
