
 Yahoo Finance
 We're A Little Worried About Pioneering Technology's (CVE:PTE) Cash Burn Rate

We can readily understand why investors are attracted to unprofitable companies. For example, although software-as-a-service business Salesforce.com lost money for years while it grew recurring revenue, if you held shares since 2005, you'd have done very well indeed. Having said that, unprofitable companies are risky because they could potentially burn through all their cash and become distressed.
So, the natural question for Pioneering Technology (CVE:PTE) shareholders is whether they should be concerned by its rate of cash burn. In this report, we will consider the company's annual negative free cash flow, henceforth referring to it as the 'cash burn'. Let's start with an examination of the business's cash, relative to its cash burn.
Check out our latest analysis for Pioneering Technology
How Long Is Pioneering Technology's Cash Runway?
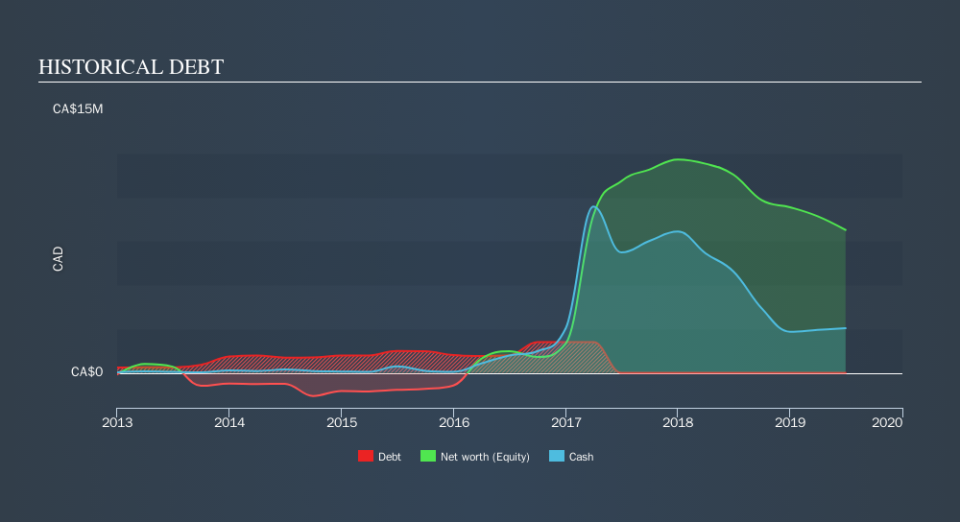
You can calculate a company's cash runway by dividing the amount of cash it has by the rate at which it is spending that cash. When Pioneering Technology last reported its balance sheet in June 2019, it had zero debt and cash worth CA$2.5m. Importantly, its cash burn was CA$3.2m over the trailing twelve months. So it had a cash runway of approximately 10 months from June 2019. That's quite a short cash runway, indicating the company must either reduce its annual cash burn or replenish its cash. The image below shows how its cash balance has been changing over the last few years.
How Well Is Pioneering Technology Growing?
Pioneering Technology actually ramped up its cash burn by a whopping 91% in the last year, which shows it is boosting investment in the business. While that's concerning on it's own, the fact that operating revenue was actually down 44% over the same period makes us positively tremulous. Considering these two factors together makes us nervous about the direction the company seems to be heading. Of course, we've only taken a quick look at the stock's growth metrics, here. This graph of historic earnings and revenue shows how Pioneering Technology is building its business over time.
How Hard Would It Be For Pioneering Technology To Raise More Cash For Growth?
Since Pioneering Technology can't yet boast improving growth metrics, the market will likely be considering how it can raise more cash if need be. Companies can raise capital through either debt or equity. One of the main advantages held by publicly listed companies is that they can sell shares to investors to raise cash to fund growth. By comparing a company's annual cash burn to its total market capitalisation, we can estimate roughly how many shares it would have to issue in order to run the company for another year (at the same burn rate).
Pioneering Technology's cash burn of CA$3.2m is about 162% of its CA$2.0m market capitalisation. That suggests the company may have some funding difficulties, and we'd be very wary of the stock.
How Risky Is Pioneering Technology's Cash Burn Situation?
As you can probably tell by now, we're rather concerned about Pioneering Technology's cash burn. In particular, we think its cash burn relative to its market cap suggests it isn't in a good position to keep funding growth. And although we accept its cash runway wasn't as worrying as its cash burn relative to its market cap, it was still a real negative; as indeed were all the factors we considered in this article. Once we consider the metrics mentioned in this article together, we're left with very little confidence in the company's ability to manage its cash burn, and we think it will probably need more money. Notably, our data indicates that Pioneering Technology insiders have been trading the shares. You can discover if they are buyers or sellers by clicking on this link.
Of course Pioneering Technology may not be the best stock to buy. So you may wish to see this free collection of companies boasting high return on equity, or this list of stocks that insiders are buying.
We aim to bring you long-term focused research analysis driven by fundamental data. Note that our analysis may not factor in the latest price-sensitive company announcements or qualitative material.
If you spot an error that warrants correction, please contact the editor at editorial-team@simplywallst.com. This article by Simply Wall St is general in nature. It does not constitute a recommendation to buy or sell any stock, and does not take account of your objectives, or your financial situation. Simply Wall St has no position in the stocks mentioned. Thank you for reading.
