
 Yahoo Finance
 Webjet's (ASX:WEB) earnings have declined over five years, contributing to shareholders 30% loss
The main aim of stock picking is to find the market-beating stocks. But the main game is to find enough winners to more than offset the losers So we wouldn't blame long term Webjet Limited (ASX:WEB) shareholders for doubting their decision to hold, with the stock down 51% over a half decade.
While the last five years has been tough for Webjet shareholders, this past week has shown signs of promise. So let's look at the longer term fundamentals and see if they've been the driver of the negative returns.
See our latest analysis for Webjet
In his essay The Superinvestors of Graham-and-Doddsville Warren Buffett described how share prices do not always rationally reflect the value of a business. One imperfect but simple way to consider how the market perception of a company has shifted is to compare the change in the earnings per share (EPS) with the share price movement.
During five years of share price growth, Webjet moved from a loss to profitability. Most would consider that to be a good thing, so it's counter-intuitive to see the share price declining. Other metrics might give us a better handle on how its value is changing over time.
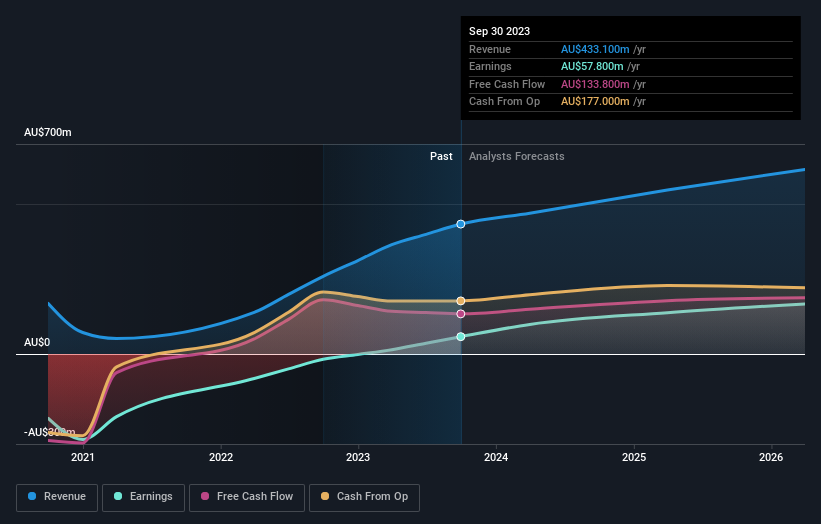
Arguably, the revenue drop of 12% a year for half a decade suggests that the company can't grow in the long term. That could explain the weak share price.
You can see below how earnings and revenue have changed over time (discover the exact values by clicking on the image).
Webjet is well known by investors, and plenty of clever analysts have tried to predict the future profit levels. So it makes a lot of sense to check out what analysts think Webjet will earn in the future (free analyst consensus estimates)
What About The Total Shareholder Return (TSR)?
Investors should note that there's a difference between Webjet's total shareholder return (TSR) and its share price change, which we've covered above. The TSR is a return calculation that accounts for the value of cash dividends (assuming that any dividend received was reinvested) and the calculated value of any discounted capital raisings and spin-offs. Its history of dividend payouts mean that Webjet's TSR, which was a 30% drop over the last 5 years, was not as bad as the share price return.
A Different Perspective
Webjet shareholders gained a total return of 9.2% during the year. But that return falls short of the market. On the bright side, that's still a gain, and it is certainly better than the yearly loss of about 5% endured over half a decade. It could well be that the business is stabilizing. Before spending more time on Webjet it might be wise to click here to see if insiders have been buying or selling shares.
Of course, you might find a fantastic investment by looking elsewhere. So take a peek at this free list of companies we expect will grow earnings.
Please note, the market returns quoted in this article reflect the market weighted average returns of stocks that currently trade on Australian exchanges.
Have feedback on this article? Concerned about the content? Get in touch with us directly. Alternatively, email editorial-team (at) simplywallst.com.
This article by Simply Wall St is general in nature. We provide commentary based on historical data and analyst forecasts only using an unbiased methodology and our articles are not intended to be financial advice. It does not constitute a recommendation to buy or sell any stock, and does not take account of your objectives, or your financial situation. We aim to bring you long-term focused analysis driven by fundamental data. Note that our analysis may not factor in the latest price-sensitive company announcements or qualitative material. Simply Wall St has no position in any stocks mentioned.
