
 Yahoo Finance
 Should Weakness in Triple Flag Precious Metals Corp.'s (TSE:TFPM) Stock Be Seen As A Sign That Market Will Correct The Share Price Given Decent Financials?
It is hard to get excited after looking at Triple Flag Precious Metals' (TSE:TFPM) recent performance, when its stock has declined 13% over the past month. But if you pay close attention, you might find that its key financial indicators look quite decent, which could mean that the stock could potentially rise in the long-term given how markets usually reward more resilient long-term fundamentals. In this article, we decided to focus on Triple Flag Precious Metals' ROE.
Return on equity or ROE is an important factor to be considered by a shareholder because it tells them how effectively their capital is being reinvested. In short, ROE shows the profit each dollar generates with respect to its shareholder investments.
View our latest analysis for Triple Flag Precious Metals
How To Calculate Return On Equity?
Return on equity can be calculated by using the formula:
Return on Equity = Net Profit (from continuing operations) ÷ Shareholders' Equity
So, based on the above formula, the ROE for Triple Flag Precious Metals is:
2.0% = US$37m ÷ US$1.8b (Based on the trailing twelve months to March 2024).
The 'return' is the income the business earned over the last year. One way to conceptualize this is that for each CA$1 of shareholders' capital it has, the company made CA$0.02 in profit.
What Has ROE Got To Do With Earnings Growth?
Thus far, we have learned that ROE measures how efficiently a company is generating its profits. We now need to evaluate how much profit the company reinvests or "retains" for future growth which then gives us an idea about the growth potential of the company. Assuming everything else remains unchanged, the higher the ROE and profit retention, the higher the growth rate of a company compared to companies that don't necessarily bear these characteristics.
Triple Flag Precious Metals' Earnings Growth And 2.0% ROE
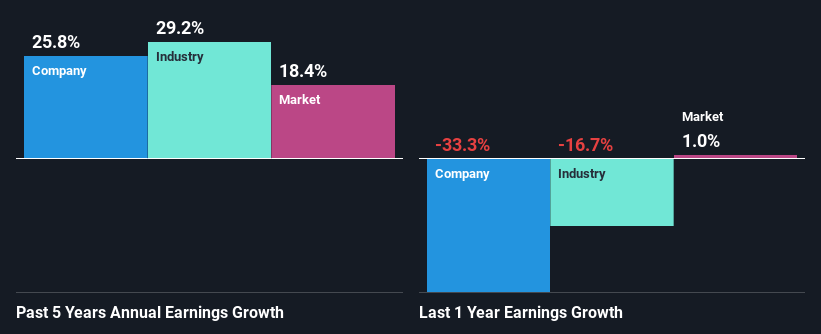
As you can see, Triple Flag Precious Metals' ROE looks pretty weak. Even when compared to the industry average of 8.4%, the ROE figure is pretty disappointing. However, we we're pleasantly surprised to see that Triple Flag Precious Metals grew its net income at a significant rate of 26% in the last five years. We believe that there might be other aspects that are positively influencing the company's earnings growth. For instance, the company has a low payout ratio or is being managed efficiently.
Next, on comparing Triple Flag Precious Metals' net income growth with the industry, we found that the company's reported growth is similar to the industry average growth rate of 29% over the last few years.
Earnings growth is a huge factor in stock valuation. It’s important for an investor to know whether the market has priced in the company's expected earnings growth (or decline). Doing so will help them establish if the stock's future looks promising or ominous. Has the market priced in the future outlook for TFPM? You can find out in our latest intrinsic value infographic research report.
Is Triple Flag Precious Metals Using Its Retained Earnings Effectively?
The high three-year median payout ratio of 58% (implying that it keeps only 42% of profits) for Triple Flag Precious Metals suggests that the company's growth wasn't really hampered despite it returning most of the earnings to its shareholders.
Besides, Triple Flag Precious Metals has been paying dividends over a period of three years. This shows that the company is committed to sharing profits with its shareholders.
Conclusion
In total, it does look like Triple Flag Precious Metals has some positive aspects to its business. While no doubt its earnings growth is pretty substantial, we do feel that the reinvestment rate is pretty low, meaning, the earnings growth number could have been significantly higher had the company been retaining more of its profits. The latest industry analyst forecasts show that the company is expected to maintain its current growth rate. Are these analysts expectations based on the broad expectations for the industry, or on the company's fundamentals? Click here to be taken to our analyst's forecasts page for the company.
Have feedback on this article? Concerned about the content? Get in touch with us directly. Alternatively, email editorial-team (at) simplywallst.com.
This article by Simply Wall St is general in nature. We provide commentary based on historical data and analyst forecasts only using an unbiased methodology and our articles are not intended to be financial advice. It does not constitute a recommendation to buy or sell any stock, and does not take account of your objectives, or your financial situation. We aim to bring you long-term focused analysis driven by fundamental data. Note that our analysis may not factor in the latest price-sensitive company announcements or qualitative material. Simply Wall St has no position in any stocks mentioned.
Have feedback on this article? Concerned about the content? Get in touch with us directly. Alternatively, email editorial-team@simplywallst.com
