
 Yahoo Finance
 Will Weakness in Sanderson Design Group plc's (LON:SDG) Stock Prove Temporary Given Strong Fundamentals?
With its stock down 8.2% over the past three months, it is easy to disregard Sanderson Design Group (LON:SDG). However, a closer look at its sound financials might cause you to think again. Given that fundamentals usually drive long-term market outcomes, the company is worth looking at. In this article, we decided to focus on Sanderson Design Group's ROE.
Return on equity or ROE is an important factor to be considered by a shareholder because it tells them how effectively their capital is being reinvested. Simply put, it is used to assess the profitability of a company in relation to its equity capital.
Check out our latest analysis for Sanderson Design Group
How Do You Calculate Return On Equity?
The formula for ROE is:
Return on Equity = Net Profit (from continuing operations) ÷ Shareholders' Equity
So, based on the above formula, the ROE for Sanderson Design Group is:
11% = UK£9.3m ÷ UK£86m (Based on the trailing twelve months to July 2023).
The 'return' refers to a company's earnings over the last year. One way to conceptualize this is that for each £1 of shareholders' capital it has, the company made £0.11 in profit.
What Has ROE Got To Do With Earnings Growth?
We have already established that ROE serves as an efficient profit-generating gauge for a company's future earnings. Depending on how much of these profits the company reinvests or "retains", and how effectively it does so, we are then able to assess a company’s earnings growth potential. Generally speaking, other things being equal, firms with a high return on equity and profit retention, have a higher growth rate than firms that don’t share these attributes.
Sanderson Design Group's Earnings Growth And 11% ROE
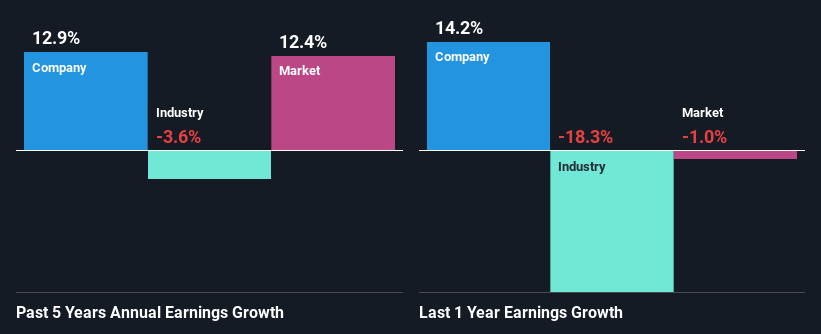
To start with, Sanderson Design Group's ROE looks acceptable. Even when compared to the industry average of 9.9% the company's ROE looks quite decent. Consequently, this likely laid the ground for the decent growth of 13% seen over the past five years by Sanderson Design Group.
Next, on comparing with the industry net income growth, we found that the growth figure reported by Sanderson Design Group compares quite favourably to the industry average, which shows a decline of 3.6% over the last few years.
Earnings growth is an important metric to consider when valuing a stock. The investor should try to establish if the expected growth or decline in earnings, whichever the case may be, is priced in. Doing so will help them establish if the stock's future looks promising or ominous. Is Sanderson Design Group fairly valued compared to other companies? These 3 valuation measures might help you decide.
Is Sanderson Design Group Making Efficient Use Of Its Profits?
Sanderson Design Group has a healthy combination of a moderate three-year median payout ratio of 27% (or a retention ratio of 73%) and a respectable amount of growth in earnings as we saw above, meaning that the company has been making efficient use of its profits.
Besides, Sanderson Design Group has been paying dividends for at least ten years or more. This shows that the company is committed to sharing profits with its shareholders. Our latest analyst data shows that the future payout ratio of the company over the next three years is expected to be approximately 27%. Accordingly, forecasts suggest that Sanderson Design Group's future ROE will be 12% which is again, similar to the current ROE.
Summary
On the whole, we feel that Sanderson Design Group's performance has been quite good. In particular, it's great to see that the company is investing heavily into its business and along with a high rate of return, that has resulted in a sizeable growth in its earnings. Having said that, on studying current analyst estimates, we were concerned to see that while the company has grown its earnings in the past, analysts expect its earnings to shrink in the future. Are these analysts expectations based on the broad expectations for the industry, or on the company's fundamentals? Click here to be taken to our analyst's forecasts page for the company.
Have feedback on this article? Concerned about the content? Get in touch with us directly. Alternatively, email editorial-team (at) simplywallst.com.
This article by Simply Wall St is general in nature. We provide commentary based on historical data and analyst forecasts only using an unbiased methodology and our articles are not intended to be financial advice. It does not constitute a recommendation to buy or sell any stock, and does not take account of your objectives, or your financial situation. We aim to bring you long-term focused analysis driven by fundamental data. Note that our analysis may not factor in the latest price-sensitive company announcements or qualitative material. Simply Wall St has no position in any stocks mentioned.
