
 Yahoo Finance
 Will Weakness in REA Group Limited's (ASX:REA) Stock Prove Temporary Given Strong Fundamentals?
With its stock down 14% over the past three months, it is easy to disregard REA Group (ASX:REA). But if you pay close attention, you might gather that its strong financials could mean that the stock could potentially see an increase in value in the long-term, given how markets usually reward companies with good financial health. Particularly, we will be paying attention to REA Group's ROE today.
ROE or return on equity is a useful tool to assess how effectively a company can generate returns on the investment it received from its shareholders. Simply put, it is used to assess the profitability of a company in relation to its equity capital.
See our latest analysis for REA Group
How Is ROE Calculated?
The formula for return on equity is:
Return on Equity = Net Profit (from continuing operations) ÷ Shareholders' Equity
So, based on the above formula, the ROE for REA Group is:
28% = AU$355m ÷ AU$1.3b (Based on the trailing twelve months to December 2021).
The 'return' refers to a company's earnings over the last year. Another way to think of that is that for every A$1 worth of equity, the company was able to earn A$0.28 in profit.
What Is The Relationship Between ROE And Earnings Growth?
We have already established that ROE serves as an efficient profit-generating gauge for a company's future earnings. We now need to evaluate how much profit the company reinvests or "retains" for future growth which then gives us an idea about the growth potential of the company. Assuming all else is equal, companies that have both a higher return on equity and higher profit retention are usually the ones that have a higher growth rate when compared to companies that don't have the same features.
REA Group's Earnings Growth And 28% ROE
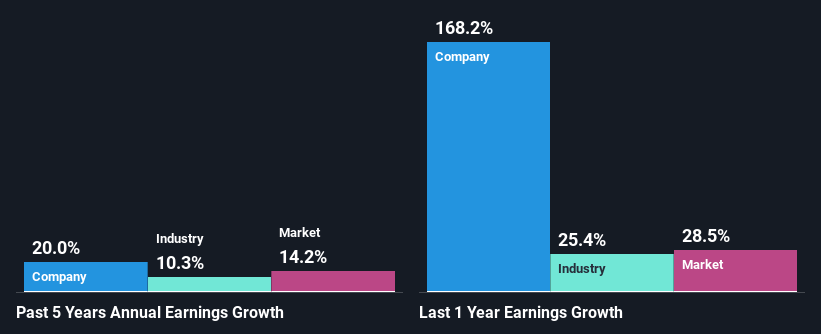
To begin with, REA Group has a pretty high ROE which is interesting. Second, a comparison with the average ROE reported by the industry of 12% also doesn't go unnoticed by us. So, the substantial 20% net income growth seen by REA Group over the past five years isn't overly surprising.
Next, on comparing with the industry net income growth, we found that REA Group's growth is quite high when compared to the industry average growth of 10% in the same period, which is great to see.
The basis for attaching value to a company is, to a great extent, tied to its earnings growth. The investor should try to establish if the expected growth or decline in earnings, whichever the case may be, is priced in. Doing so will help them establish if the stock's future looks promising or ominous. What is REA worth today? The intrinsic value infographic in our free research report helps visualize whether REA is currently mispriced by the market.
Is REA Group Efficiently Re-investing Its Profits?
The high three-year median payout ratio of 88% (implying that it keeps only 12% of profits) for REA Group suggests that the company's growth wasn't really hampered despite it returning most of the earnings to its shareholders.
Besides, REA Group has been paying dividends for at least ten years or more. This shows that the company is committed to sharing profits with its shareholders. Our latest analyst data shows that the future payout ratio of the company is expected to drop to 55% over the next three years. Despite the lower expected payout ratio, the company's ROE is not expected to change by much.
Conclusion
Overall, we are quite pleased with REA Group's performance. In particular, its high ROE is quite noteworthy and also the probable explanation behind its considerable earnings growth. Yet, the company is retaining a small portion of its profits. Which means that the company has been able to grow its earnings in spite of it, so that's not too bad. Having said that, the company's earnings growth is expected to slow down, as forecasted in the current analyst estimates. To know more about the latest analysts predictions for the company, check out this visualization of analyst forecasts for the company.
Have feedback on this article? Concerned about the content? Get in touch with us directly. Alternatively, email editorial-team (at) simplywallst.com.
This article by Simply Wall St is general in nature. We provide commentary based on historical data and analyst forecasts only using an unbiased methodology and our articles are not intended to be financial advice. It does not constitute a recommendation to buy or sell any stock, and does not take account of your objectives, or your financial situation. We aim to bring you long-term focused analysis driven by fundamental data. Note that our analysis may not factor in the latest price-sensitive company announcements or qualitative material. Simply Wall St has no position in any stocks mentioned.
