
 Yahoo Finance
 Should Weakness in P.A.M. Transportation Services, Inc.'s (NASDAQ:PTSI) Stock Be Seen As A Sign That Market Will Correct The Share Price Given Decent Financials?
P.A.M. Transportation Services (NASDAQ:PTSI) has had a rough three months with its share price down 26%. However, the company's fundamentals look pretty decent, and long-term financials are usually aligned with future market price movements. Particularly, we will be paying attention to P.A.M. Transportation Services' ROE today.
Return on equity or ROE is an important factor to be considered by a shareholder because it tells them how effectively their capital is being reinvested. Put another way, it reveals the company's success at turning shareholder investments into profits.
See our latest analysis for P.A.M. Transportation Services
How To Calculate Return On Equity?
The formula for ROE is:
Return on Equity = Net Profit (from continuing operations) ÷ Shareholders' Equity
So, based on the above formula, the ROE for P.A.M. Transportation Services is:
5.9% = US$18m ÷ US$314m (Based on the trailing twelve months to December 2023).
The 'return' is the profit over the last twelve months. That means that for every $1 worth of shareholders' equity, the company generated $0.06 in profit.
What Is The Relationship Between ROE And Earnings Growth?
So far, we've learned that ROE is a measure of a company's profitability. Based on how much of its profits the company chooses to reinvest or "retain", we are then able to evaluate a company's future ability to generate profits. Generally speaking, other things being equal, firms with a high return on equity and profit retention, have a higher growth rate than firms that don’t share these attributes.
P.A.M. Transportation Services' Earnings Growth And 5.9% ROE
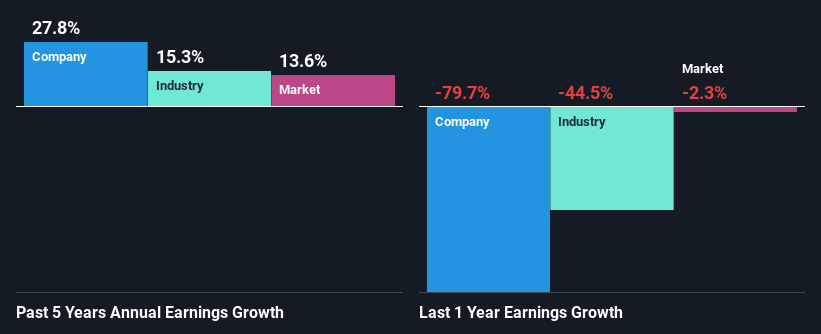
At first glance, P.A.M. Transportation Services' ROE doesn't look very promising. We then compared the company's ROE to the broader industry and were disappointed to see that the ROE is lower than the industry average of 14%. Despite this, surprisingly, P.A.M. Transportation Services saw an exceptional 28% net income growth over the past five years. Therefore, there could be other reasons behind this growth. Such as - high earnings retention or an efficient management in place.
We then compared P.A.M. Transportation Services' net income growth with the industry and we're pleased to see that the company's growth figure is higher when compared with the industry which has a growth rate of 15% in the same 5-year period.
The basis for attaching value to a company is, to a great extent, tied to its earnings growth. What investors need to determine next is if the expected earnings growth, or the lack of it, is already built into the share price. Doing so will help them establish if the stock's future looks promising or ominous. If you're wondering about P.A.M. Transportation Services''s valuation, check out this gauge of its price-to-earnings ratio, as compared to its industry.
Is P.A.M. Transportation Services Making Efficient Use Of Its Profits?
P.A.M. Transportation Services doesn't pay any dividend currently which essentially means that it has been reinvesting all of its profits into the business. This definitely contributes to the high earnings growth number that we discussed above.
Conclusion
In total, it does look like P.A.M. Transportation Services has some positive aspects to its business. Even in spite of the low rate of return, the company has posted impressive earnings growth as a result of reinvesting heavily into its business. While we won't completely dismiss the company, what we would do, is try to ascertain how risky the business is to make a more informed decision around the company. To know the 1 risk we have identified for P.A.M. Transportation Services visit our risks dashboard for free.
Have feedback on this article? Concerned about the content? Get in touch with us directly. Alternatively, email editorial-team (at) simplywallst.com.
This article by Simply Wall St is general in nature. We provide commentary based on historical data and analyst forecasts only using an unbiased methodology and our articles are not intended to be financial advice. It does not constitute a recommendation to buy or sell any stock, and does not take account of your objectives, or your financial situation. We aim to bring you long-term focused analysis driven by fundamental data. Note that our analysis may not factor in the latest price-sensitive company announcements or qualitative material. Simply Wall St has no position in any stocks mentioned.
