
 Yahoo Finance
 Be Wary Of PermRock Royalty Trust (NYSE:PRT) And Its Returns On Capital
What underlying fundamental trends can indicate that a company might be in decline? Typically, we'll see the trend of both return on capital employed (ROCE) declining and this usually coincides with a decreasing amount of capital employed. This reveals that the company isn't compounding shareholder wealth because returns are falling and its net asset base is shrinking. On that note, looking into PermRock Royalty Trust (NYSE:PRT), we weren't too upbeat about how things were going.
Understanding Return On Capital Employed (ROCE)
For those who don't know, ROCE is a measure of a company's yearly pre-tax profit (its return), relative to the capital employed in the business. To calculate this metric for PermRock Royalty Trust, this is the formula:
Return on Capital Employed = Earnings Before Interest and Tax (EBIT) ÷ (Total Assets - Current Liabilities)
0.11 = US$8.8m ÷ (US$85m - US$864k) (Based on the trailing twelve months to March 2022).
Thus, PermRock Royalty Trust has an ROCE of 11%. In absolute terms, that's a pretty normal return, and it's somewhat close to the Oil and Gas industry average of 12%.
Check out our latest analysis for PermRock Royalty Trust
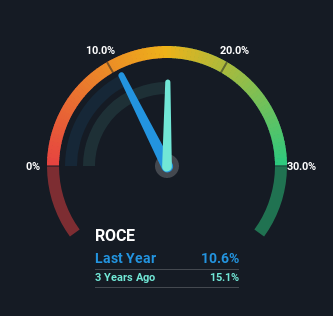
Historical performance is a great place to start when researching a stock so above you can see the gauge for PermRock Royalty Trust's ROCE against it's prior returns. If you're interested in investigating PermRock Royalty Trust's past further, check out this free graph of past earnings, revenue and cash flow.
What Does the ROCE Trend For PermRock Royalty Trust Tell Us?
There is reason to be cautious about PermRock Royalty Trust, given the returns are trending downwards. Unfortunately the returns on capital have diminished from the 15% that they were earning three years ago. Meanwhile, capital employed in the business has stayed roughly the flat over the period. This combination can be indicative of a mature business that still has areas to deploy capital, but the returns received aren't as high due potentially to new competition or smaller margins. If these trends continue, we wouldn't expect PermRock Royalty Trust to turn into a multi-bagger.
Our Take On PermRock Royalty Trust's ROCE
In the end, the trend of lower returns on the same amount of capital isn't typically an indication that we're looking at a growth stock. However the stock has delivered a 29% return to shareholders over the last three years, so investors might be expecting the trends to turn around. In any case, the current underlying trends don't bode well for long term performance so unless they reverse, we'd start looking elsewhere.
If you'd like to know more about PermRock Royalty Trust, we've spotted 4 warning signs, and 1 of them can't be ignored.
While PermRock Royalty Trust may not currently earn the highest returns, we've compiled a list of companies that currently earn more than 25% return on equity. Check out this free list here.
Have feedback on this article? Concerned about the content? Get in touch with us directly. Alternatively, email editorial-team (at) simplywallst.com.
This article by Simply Wall St is general in nature. We provide commentary based on historical data and analyst forecasts only using an unbiased methodology and our articles are not intended to be financial advice. It does not constitute a recommendation to buy or sell any stock, and does not take account of your objectives, or your financial situation. We aim to bring you long-term focused analysis driven by fundamental data. Note that our analysis may not factor in the latest price-sensitive company announcements or qualitative material. Simply Wall St has no position in any stocks mentioned.
