
 Yahoo Finance
 Be Wary Of Jewett-Cameron Trading (NASDAQ:JCTC.F) And Its Returns On Capital
When researching a stock for investment, what can tell us that the company is in decline? Typically, we'll see the trend of both return on capital employed (ROCE) declining and this usually coincides with a decreasing amount of capital employed. Basically the company is earning less on its investments and it is also reducing its total assets. On that note, looking into Jewett-Cameron Trading (NASDAQ:JCTC.F), we weren't too upbeat about how things were going.
Return On Capital Employed (ROCE): What Is It?
For those who don't know, ROCE is a measure of a company's yearly pre-tax profit (its return), relative to the capital employed in the business. To calculate this metric for Jewett-Cameron Trading, this is the formula:
Return on Capital Employed = Earnings Before Interest and Tax (EBIT) ÷ (Total Assets - Current Liabilities)
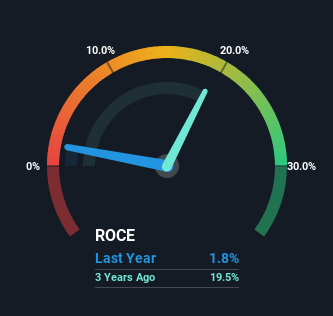
0.018 = US$431k ÷ (US$30m - US$5.7m) (Based on the trailing twelve months to August 2023).
Therefore, Jewett-Cameron Trading has an ROCE of 1.8%. In absolute terms, that's a low return and it also under-performs the Building industry average of 16%.
View our latest analysis for Jewett-Cameron Trading
While the past is not representative of the future, it can be helpful to know how a company has performed historically, which is why we have this chart above. If you'd like to look at how Jewett-Cameron Trading has performed in the past in other metrics, you can view this free graph of past earnings, revenue and cash flow.
So How Is Jewett-Cameron Trading's ROCE Trending?
There is reason to be cautious about Jewett-Cameron Trading, given the returns are trending downwards. About five years ago, returns on capital were 20%, however they're now substantially lower than that as we saw above. And on the capital employed front, the business is utilizing roughly the same amount of capital as it was back then. Companies that exhibit these attributes tend to not be shrinking, but they can be mature and facing pressure on their margins from competition. If these trends continue, we wouldn't expect Jewett-Cameron Trading to turn into a multi-bagger.
The Bottom Line On Jewett-Cameron Trading's ROCE
All in all, the lower returns from the same amount of capital employed aren't exactly signs of a compounding machine. Investors haven't taken kindly to these developments, since the stock has declined 34% from where it was five years ago. That being the case, unless the underlying trends revert to a more positive trajectory, we'd consider looking elsewhere.
If you want to know some of the risks facing Jewett-Cameron Trading we've found 2 warning signs (1 can't be ignored!) that you should be aware of before investing here.
For those who like to invest in solid companies, check out this free list of companies with solid balance sheets and high returns on equity.
Have feedback on this article? Concerned about the content? Get in touch with us directly. Alternatively, email editorial-team (at) simplywallst.com.
This article by Simply Wall St is general in nature. We provide commentary based on historical data and analyst forecasts only using an unbiased methodology and our articles are not intended to be financial advice. It does not constitute a recommendation to buy or sell any stock, and does not take account of your objectives, or your financial situation. We aim to bring you long-term focused analysis driven by fundamental data. Note that our analysis may not factor in the latest price-sensitive company announcements or qualitative material. Simply Wall St has no position in any stocks mentioned.
