
 Yahoo Finance
 Be Wary Of HELLA GmbH KGaA (ETR:HLE) And Its Returns On Capital
If we're looking to avoid a business that is in decline, what are the trends that can warn us ahead of time? A business that's potentially in decline often shows two trends, a return on capital employed (ROCE) that's declining, and a base of capital employed that's also declining. Trends like this ultimately mean the business is reducing its investments and also earning less on what it has invested. In light of that, from a first glance at HELLA GmbH KGaA (ETR:HLE), we've spotted some signs that it could be struggling, so let's investigate.
What Is Return On Capital Employed (ROCE)?
If you haven't worked with ROCE before, it measures the 'return' (pre-tax profit) a company generates from capital employed in its business. The formula for this calculation on HELLA GmbH KGaA is:
Return on Capital Employed = Earnings Before Interest and Tax (EBIT) ÷ (Total Assets - Current Liabilities)
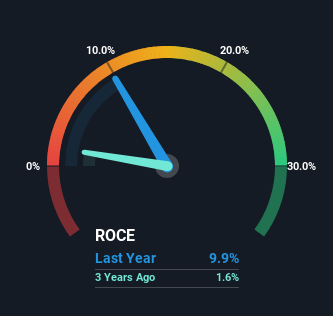
0.099 = €433m ÷ (€7.1b - €2.7b) (Based on the trailing twelve months to December 2023).
So, HELLA GmbH KGaA has an ROCE of 9.9%. On its own that's a low return on capital but it's in line with the industry's average returns of 9.9%.
View our latest analysis for HELLA GmbH KGaA
In the above chart we have measured HELLA GmbH KGaA's prior ROCE against its prior performance, but the future is arguably more important. If you'd like, you can check out the forecasts from the analysts covering HELLA GmbH KGaA for free.
The Trend Of ROCE
In terms of HELLA GmbH KGaA's historical ROCE movements, the trend doesn't inspire confidence. To be more specific, the ROCE was 15% five years ago, but since then it has dropped noticeably. On top of that, it's worth noting that the amount of capital employed within the business has remained relatively steady. Companies that exhibit these attributes tend to not be shrinking, but they can be mature and facing pressure on their margins from competition. So because these trends aren't typically conducive to creating a multi-bagger, we wouldn't hold our breath on HELLA GmbH KGaA becoming one if things continue as they have.
While on the subject, we noticed that the ratio of current liabilities to total assets has risen to 38%, which has impacted the ROCE. If current liabilities hadn't increased as much as they did, the ROCE could actually be even lower. While the ratio isn't currently too high, it's worth keeping an eye on this because if it gets particularly high, the business could then face some new elements of risk.
The Bottom Line
In summary, it's unfortunate that HELLA GmbH KGaA is generating lower returns from the same amount of capital. The market must be rosy on the stock's future because even though the underlying trends aren't too encouraging, the stock has soared 119%. Regardless, we don't feel too comfortable with the fundamentals so we'd be steering clear of this stock for now.
One final note, you should learn about the 2 warning signs we've spotted with HELLA GmbH KGaA (including 1 which can't be ignored) .
For those who like to invest in solid companies, check out this free list of companies with solid balance sheets and high returns on equity.
Have feedback on this article? Concerned about the content? Get in touch with us directly. Alternatively, email editorial-team (at) simplywallst.com.
This article by Simply Wall St is general in nature. We provide commentary based on historical data and analyst forecasts only using an unbiased methodology and our articles are not intended to be financial advice. It does not constitute a recommendation to buy or sell any stock, and does not take account of your objectives, or your financial situation. We aim to bring you long-term focused analysis driven by fundamental data. Note that our analysis may not factor in the latest price-sensitive company announcements or qualitative material. Simply Wall St has no position in any stocks mentioned.
