
 Yahoo Finance
 Warehouses De Pauw SA's Dividend Analysis
Assessing the Sustainability and Growth of Warehouses De Pauw SA's Dividends
Warehouses De Pauw SA (WDPSF) recently announced a dividend of $1.12 per share, payable on 0000-00-00, with the ex-dividend date set for 2024-04-25. As investors look forward to this upcoming payment, the spotlight also shines on the company's dividend history, yield, and growth rates. Using the data from GuruFocus, let's delve into Warehouses De Pauw SA's dividend performance and assess its sustainability.
What Does Warehouses De Pauw SA Do?
This Powerful Chart Made Peter Lynch 29% A Year For 13 Years
How to calculate the intrinsic value of a stock?
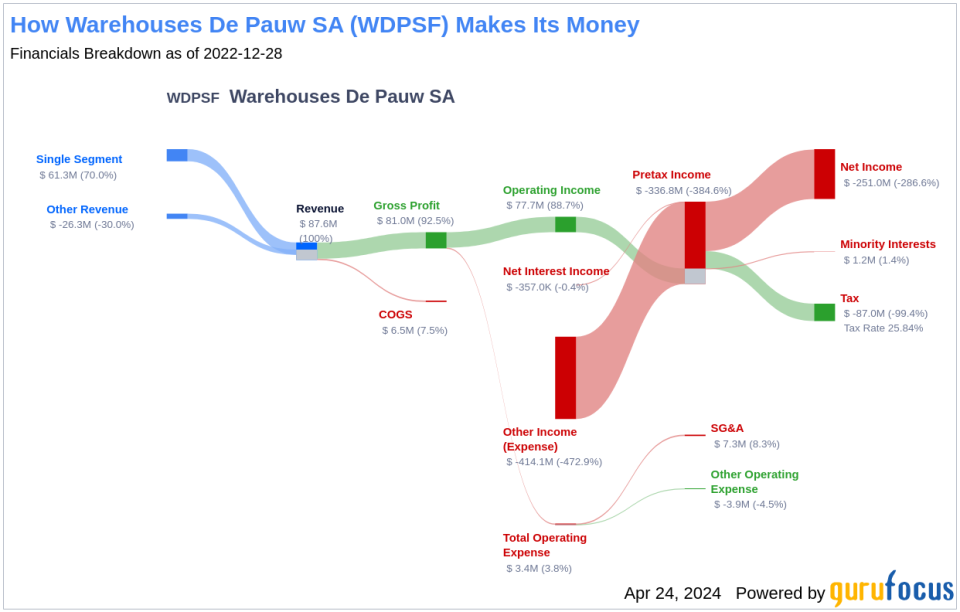
Warehouses De Pauw is a real estate investment trust engaged in the acquisition and development of storage, distribution, and semi-industrial facilities throughout Europe. The vast majority of the company's real estate portfolio in terms of square footage and total rental value is made up of general warehouse space, while offices represent a smaller amount. These properties are mainly located in Belgium and the Netherlands near large transportation hubs. Warehouses De Pauw derives nearly all of its revenue in the form of rental income from the same two countries. The company's tenants in terms of revenue include solar panels, third-party logistics firms, and food industry companies. Warehouses De Pauw is also active in the logistics property markets of France and Romania.
A Glimpse at Warehouses De Pauw SA's Dividend History
Warehouses De Pauw SA has maintained a consistent dividend payment record since 2016. Dividends are currently distributed on a yearly basis. Below is a chart showing annual Dividends Per Share for tracking historical trends.
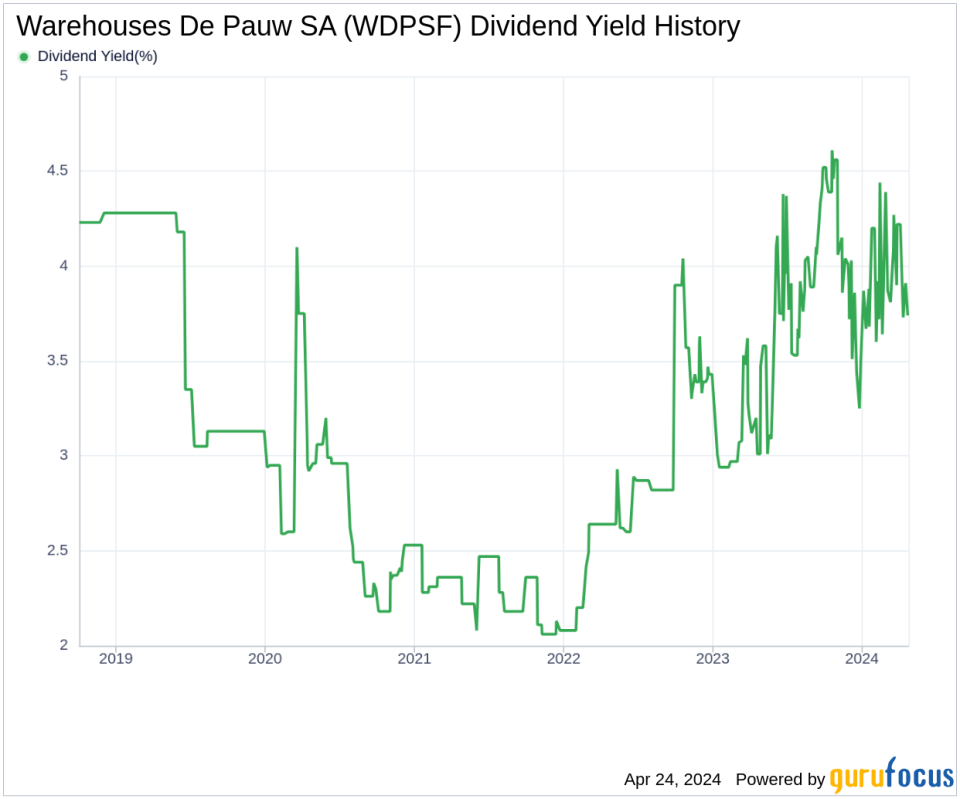
Breaking Down Warehouses De Pauw SA's Dividend Yield and Growth
As of today, Warehouses De Pauw SA currently has a 12-month trailing dividend yield of 3.71% and a 12-month forward dividend yield of 4.15%. This suggests an expectation of increased dividend payments over the next 12 months. Over the past three years, Warehouses De Pauw SA's annual dividend growth rate was 8.70%. Extended to a five-year horizon, this rate decreased to 7.60% per year. And over the past decade, Warehouses De Pauw SA's annual dividends per share growth rate stands at 7.90%.
Based on Warehouses De Pauw SA's dividend yield and five-year growth rate, the 5-year yield on cost of Warehouses De Pauw SA stock as of today is approximately 5.35%.
The Sustainability Question: Payout Ratio and Profitability
To assess the sustainability of the dividend, one needs to evaluate the company's payout ratio. The dividend payout ratio provides insights into the portion of earnings the company distributes as dividends. A lower ratio suggests that the company retains a significant part of its earnings, thereby ensuring the availability of funds for future growth and unexpected downturns. As of 2023-09-30, Warehouses De Pauw SA's dividend payout ratio is 0.00.
Warehouses De Pauw SA's profitability rank, offers an understanding of the company's earnings prowess relative to its peers. GuruFocus ranks Warehouses De Pauw SA's profitability 8 out of 10 as of 2023-09-30, suggesting good profitability prospects. The company has reported positive net income for each of year over the past decade, further solidifying its high profitability.
Growth Metrics: The Future Outlook
To ensure the sustainability of dividends, a company must have robust growth metrics. Warehouses De Pauw SA's growth rank of 8 out of 10 suggests that the company's growth trajectory is good relative to its competitors.
Revenue is the lifeblood of any company, and Warehouses De Pauw SA's revenue per share, combined with the 3-year revenue growth rate, indicates a strong revenue model. Warehouses De Pauw SA's revenue has increased by approximately 9.00% per year on average, a rate that outperforms approximately 71.3% of global competitors.
The company's 3-year EPS growth rate showcases its capability to grow its earnings, a critical component for sustaining dividends in the long run. During the past three years, Warehouses De Pauw SA's earnings increased by approximately 3.50% per year on average, a rate that outperforms approximately 46.76% of global competitors.
Lastly, the company's 5-year EBITDA growth rate of 14.40%, which outperforms approximately 81.41% of global competitors.
Next Steps
In conclusion, Warehouses De Pauw SA's consistent dividend payments, robust dividend growth rate, and a payout ratio that indicates room for growth, all point towards a sustainable dividend policy. Coupled with the company's strong profitability and growth metrics, Warehouses De Pauw SA appears well-positioned to maintain, if not enhance, its dividend distributions in the foreseeable future. Investors considering dividend stocks for their portfolios might find Warehouses De Pauw SA an attractive option, given its performance and prospects. Will the company continue to uphold its dividend reputation in the coming years? Only time will tell, but the indicators certainly seem promising.
GuruFocus Premium users can screen for high-dividend yield stocks using the High Dividend Yield Screener.
This article, generated by GuruFocus, is designed to provide general insights and is not tailored financial advice. Our commentary is rooted in historical data and analyst projections, utilizing an impartial methodology, and is not intended to serve as specific investment guidance. It does not formulate a recommendation to purchase or divest any stock and does not consider individual investment objectives or financial circumstances. Our objective is to deliver long-term, fundamental data-driven analysis. Be aware that our analysis might not incorporate the most recent, price-sensitive company announcements or qualitative information. GuruFocus holds no position in the stocks mentioned herein.
This article first appeared on GuruFocus.
