
 Yahoo Finance
 Wallbox (NYSE:WBX) one-year losses have grown faster than shareholder returns have fallen, but the stock lifts 8.4% this past week
It's normal to be annoyed when stock you own has a declining share price. But sometimes broader market conditions have more of an impact on prices than the actual business performance. The Wallbox N.V. (NYSE:WBX) share price is down 11% in the last year. But that actually beats the market decline of 13%. Wallbox hasn't been listed for long, so although we're wary of recent listings that perform poorly, it may still prove itself with time. It's down 25% in about a quarter.
On a more encouraging note the company has added €111m to its market cap in just the last 7 days, so let's see if we can determine what's driven the one-year loss for shareholders.
View our latest analysis for Wallbox
Given that Wallbox didn't make a profit in the last twelve months, we'll focus on revenue growth to form a quick view of its business development. Shareholders of unprofitable companies usually expect strong revenue growth. Some companies are willing to postpone profitability to grow revenue faster, but in that case one does expect good top-line growth.
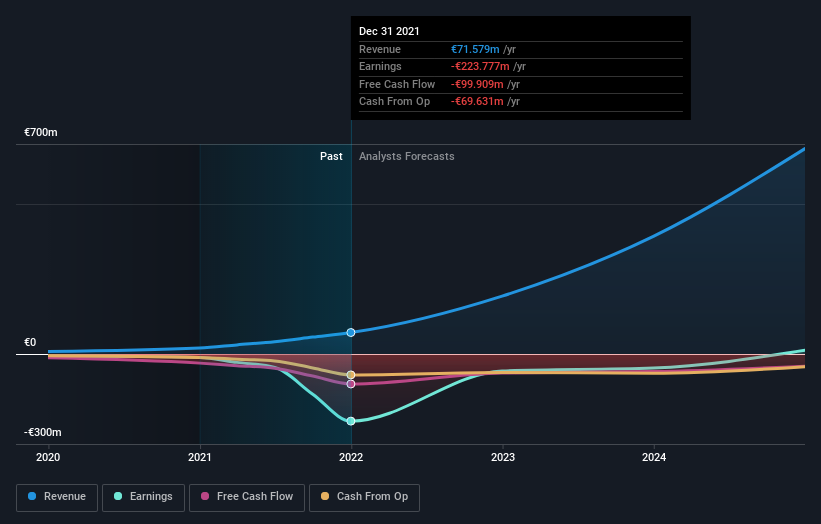
Wallbox grew its revenue by 264% over the last year. That's well above most other pre-profit companies. While the share price is down 11% in the last year, not too bad given the weak market. Given the strong revenue growth, it may simply be that the stock is suffering from market conditions. For us, this sort of situation smells of opportunity - the share price is down but the revenue is up. Either way, we'd say the mismatch between the revenue growth and the share price justifies a closer look.
You can see how earnings and revenue have changed over time in the image below (click on the chart to see the exact values).
Take a more thorough look at Wallbox's financial health with this free report on its balance sheet.
A Different Perspective
It's not great that Wallbox shares failed to make money for shareholders in the last year, but the silver lining is that the loss of 11%, wasn't as bad as the broader market loss of about 13%. However, the problem arose in the last three months, which saw the share price drop 25%. It's always a worry to see a share price decline like that, but at the same time, it is an unavoidable part of investing. However, this could create an opportunity if the fundamentals remain strong. I find it very interesting to look at share price over the long term as a proxy for business performance. But to truly gain insight, we need to consider other information, too. For example, we've discovered 1 warning sign for Wallbox that you should be aware of before investing here.
But note: Wallbox may not be the best stock to buy. So take a peek at this free list of interesting companies with past earnings growth (and further growth forecast).
Please note, the market returns quoted in this article reflect the market weighted average returns of stocks that currently trade on US exchanges.
Have feedback on this article? Concerned about the content? Get in touch with us directly. Alternatively, email editorial-team (at) simplywallst.com.
This article by Simply Wall St is general in nature. We provide commentary based on historical data and analyst forecasts only using an unbiased methodology and our articles are not intended to be financial advice. It does not constitute a recommendation to buy or sell any stock, and does not take account of your objectives, or your financial situation. We aim to bring you long-term focused analysis driven by fundamental data. Note that our analysis may not factor in the latest price-sensitive company announcements or qualitative material. Simply Wall St has no position in any stocks mentioned.
Join A Paid User Research Session
You’ll receive a US$30 Amazon Gift card for 1 hour of your time while helping us build better investing tools for the individual investors like yourself. Sign up here