
 Yahoo Finance
 In the wake of Farfetch Limited's (NYSE:FTCH) latest US$313m market cap drop, institutional owners may be forced to take severe actions
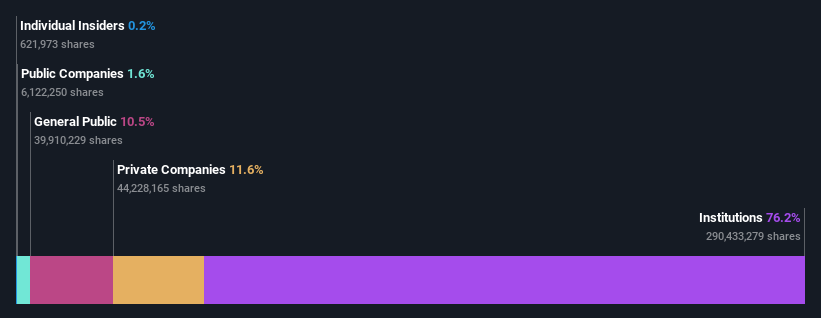
Every investor in Farfetch Limited (NYSE:FTCH) should be aware of the most powerful shareholder groups. We can see that institutions own the lion's share in the company with 76% ownership. That is, the group stands to benefit the most if the stock rises (or lose the most if there is a downturn).
And institutional investors endured the highest losses after the company's share price fell by 13% last week. Needless to say, the recent loss which further adds to the one-year loss to shareholders of 72% might not go down well especially with this category of shareholders. Institutions or "liquidity providers" control large sums of money and therefore, these types of investors usually have a lot of influence over stock price movements. Hence, if weakness in Farfetch's share price continues, institutional investors may feel compelled to sell the stock, which might not be ideal for individual investors.
In the chart below, we zoom in on the different ownership groups of Farfetch.
See our latest analysis for Farfetch
What Does The Institutional Ownership Tell Us About Farfetch?
Institutions typically measure themselves against a benchmark when reporting to their own investors, so they often become more enthusiastic about a stock once it's included in a major index. We would expect most companies to have some institutions on the register, especially if they are growing.
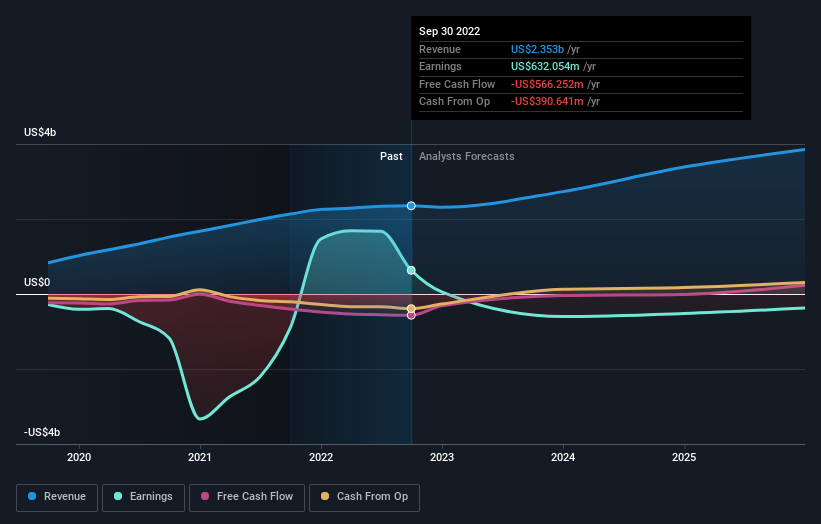
Farfetch already has institutions on the share registry. Indeed, they own a respectable stake in the company. This implies the analysts working for those institutions have looked at the stock and they like it. But just like anyone else, they could be wrong. When multiple institutions own a stock, there's always a risk that they are in a 'crowded trade'. When such a trade goes wrong, multiple parties may compete to sell stock fast. This risk is higher in a company without a history of growth. You can see Farfetch's historic earnings and revenue below, but keep in mind there's always more to the story.
Since institutional investors own more than half the issued stock, the board will likely have to pay attention to their preferences. Hedge funds don't have many shares in Farfetch. Baillie Gifford & Co. is currently the company's largest shareholder with 12% of shares outstanding. Tgf Participations Limited is the second largest shareholder owning 11% of common stock, and Morgan Stanley Investment Management Inc. holds about 8.2% of the company stock.
On further inspection, we found that more than half the company's shares are owned by the top 8 shareholders, suggesting that the interests of the larger shareholders are balanced out to an extent by the smaller ones.
While it makes sense to study institutional ownership data for a company, it also makes sense to study analyst sentiments to know which way the wind is blowing. Quite a few analysts cover the stock, so you could look into forecast growth quite easily.
Insider Ownership Of Farfetch
The definition of company insiders can be subjective and does vary between jurisdictions. Our data reflects individual insiders, capturing board members at the very least. The company management answer to the board and the latter should represent the interests of shareholders. Notably, sometimes top-level managers are on the board themselves.
Most consider insider ownership a positive because it can indicate the board is well aligned with other shareholders. However, on some occasions too much power is concentrated within this group.
Our data suggests that insiders own under 1% of Farfetch Limited in their own names. We do note, however, it is possible insiders have an indirect interest through a private company or other corporate structure. It's a big company, so even a small proportional interest can create alignment between the board and shareholders. In this case insiders own US$3.5m worth of shares. It is always good to see at least some insider ownership, but it might be worth checking if those insiders have been selling.
General Public Ownership
The general public, who are usually individual investors, hold a 10% stake in Farfetch. While this group can't necessarily call the shots, it can certainly have a real influence on how the company is run.
Private Company Ownership
It seems that Private Companies own 12%, of the Farfetch stock. It's hard to draw any conclusions from this fact alone, so its worth looking into who owns those private companies. Sometimes insiders or other related parties have an interest in shares in a public company through a separate private company.
Next Steps:
While it is well worth considering the different groups that own a company, there are other factors that are even more important. To that end, you should learn about the 3 warning signs we've spotted with Farfetch (including 1 which makes us a bit uncomfortable) .
But ultimately it is the future, not the past, that will determine how well the owners of this business will do. Therefore we think it advisable to take a look at this free report showing whether analysts are predicting a brighter future.
NB: Figures in this article are calculated using data from the last twelve months, which refer to the 12-month period ending on the last date of the month the financial statement is dated. This may not be consistent with full year annual report figures.
Have feedback on this article? Concerned about the content? Get in touch with us directly. Alternatively, email editorial-team (at) simplywallst.com.
This article by Simply Wall St is general in nature. We provide commentary based on historical data and analyst forecasts only using an unbiased methodology and our articles are not intended to be financial advice. It does not constitute a recommendation to buy or sell any stock, and does not take account of your objectives, or your financial situation. We aim to bring you long-term focused analysis driven by fundamental data. Note that our analysis may not factor in the latest price-sensitive company announcements or qualitative material. Simply Wall St has no position in any stocks mentioned.
Join A Paid User Research Session
You’ll receive a US$30 Amazon Gift card for 1 hour of your time while helping us build better investing tools for the individual investors like yourself. Sign up here
