
 Yahoo Finance
 Is W.W. Grainger, Inc.'s (NYSE:GWW) Stock's Recent Performance Being Led By Its Attractive Financial Prospects?
W.W. Grainger (NYSE:GWW) has had a great run on the share market with its stock up by a significant 20% over the last three months. Given the company's impressive performance, we decided to study its financial indicators more closely as a company's financial health over the long-term usually dictates market outcomes. Specifically, we decided to study W.W. Grainger's ROE in this article.
Return on equity or ROE is an important factor to be considered by a shareholder because it tells them how effectively their capital is being reinvested. In other words, it is a profitability ratio which measures the rate of return on the capital provided by the company's shareholders.
View our latest analysis for W.W. Grainger
How To Calculate Return On Equity?
The formula for return on equity is:
Return on Equity = Net Profit (from continuing operations) ÷ Shareholders' Equity
So, based on the above formula, the ROE for W.W. Grainger is:
56% = US$1.9b ÷ US$3.4b (Based on the trailing twelve months to September 2023).
The 'return' is the yearly profit. That means that for every $1 worth of shareholders' equity, the company generated $0.56 in profit.
What Has ROE Got To Do With Earnings Growth?
We have already established that ROE serves as an efficient profit-generating gauge for a company's future earnings. Based on how much of its profits the company chooses to reinvest or "retain", we are then able to evaluate a company's future ability to generate profits. Assuming everything else remains unchanged, the higher the ROE and profit retention, the higher the growth rate of a company compared to companies that don't necessarily bear these characteristics.
A Side By Side comparison of W.W. Grainger's Earnings Growth And 56% ROE
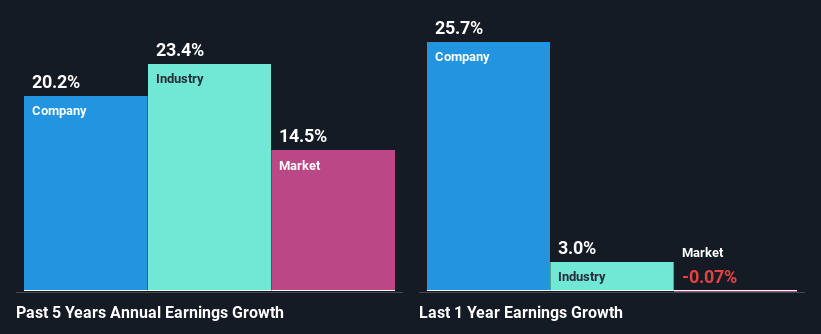
To begin with, W.W. Grainger has a pretty high ROE which is interesting. Secondly, even when compared to the industry average of 17% the company's ROE is quite impressive. So, the substantial 20% net income growth seen by W.W. Grainger over the past five years isn't overly surprising.
Next, on comparing W.W. Grainger's net income growth with the industry, we found that the company's reported growth is similar to the industry average growth rate of 23% over the last few years.
The basis for attaching value to a company is, to a great extent, tied to its earnings growth. It’s important for an investor to know whether the market has priced in the company's expected earnings growth (or decline). Doing so will help them establish if the stock's future looks promising or ominous. One good indicator of expected earnings growth is the P/E ratio which determines the price the market is willing to pay for a stock based on its earnings prospects. So, you may want to check if W.W. Grainger is trading on a high P/E or a low P/E, relative to its industry.
Is W.W. Grainger Using Its Retained Earnings Effectively?
W.W. Grainger has a three-year median payout ratio of 29% (where it is retaining 71% of its income) which is not too low or not too high. By the looks of it, the dividend is well covered and W.W. Grainger is reinvesting its profits efficiently as evidenced by its exceptional growth which we discussed above.
Moreover, W.W. Grainger is determined to keep sharing its profits with shareholders which we infer from its long history of paying a dividend for at least ten years. Our latest analyst data shows that the future payout ratio of the company is expected to drop to 20% over the next three years. However, W.W. Grainger's future ROE is expected to decline to 42% despite the expected decline in its payout ratio. We infer that there could be other factors that could be steering the foreseen decline in the company's ROE.
Summary
On the whole, we feel that W.W. Grainger's performance has been quite good. Particularly, we like that the company is reinvesting heavily into its business, and at a high rate of return. Unsurprisingly, this has led to an impressive earnings growth. Having said that, the company's earnings growth is expected to slow down, as forecasted in the current analyst estimates. Are these analysts expectations based on the broad expectations for the industry, or on the company's fundamentals? Click here to be taken to our analyst's forecasts page for the company.
Have feedback on this article? Concerned about the content? Get in touch with us directly. Alternatively, email editorial-team (at) simplywallst.com.
This article by Simply Wall St is general in nature. We provide commentary based on historical data and analyst forecasts only using an unbiased methodology and our articles are not intended to be financial advice. It does not constitute a recommendation to buy or sell any stock, and does not take account of your objectives, or your financial situation. We aim to bring you long-term focused analysis driven by fundamental data. Note that our analysis may not factor in the latest price-sensitive company announcements or qualitative material. Simply Wall St has no position in any stocks mentioned.
