
 Yahoo Finance
 Is VIS Containers Manufacturing Co. Ltd (ATH:VIS) A Financially Sound Company?

VIS Containers Manufacturing Co. Ltd (ATH:VIS) is a small-cap stock with a market capitalization of €4.6m. While investors primarily focus on the growth potential and competitive landscape of the small-cap companies, they end up ignoring a key aspect, which could be the biggest threat to its existence: its financial health. Why is it important? Since VIS is loss-making right now, it’s crucial to understand the current state of its operations and pathway to profitability. Here are a few basic checks that are good enough to have a broad overview of the company’s financial strength. Though, this commentary is still very high-level, so I’d encourage you to dig deeper yourself into VIS here.
How does VIS’s operating cash flow stack up against its debt?
VIS has sustained its debt level by about €14m over the last 12 months including long-term debt. At this stable level of debt, VIS’s cash and short-term investments stands at €136k for investing into the business. Moving onto cash from operations, its operating cash flow is not yet significant enough to calculate a meaningful cash-to-debt ratio, indicating that operational efficiency is something we’d need to take a look at. As the purpose of this article is a high-level overview, I won’t be looking at this today, but you can assess some of VIS’s operating efficiency ratios such as ROA here.
Can VIS meet its short-term obligations with the cash in hand?
With current liabilities at €12m, it appears that the company has maintained a safe level of current assets to meet its obligations, with the current ratio last standing at 1.19x. Usually, for Packaging companies, this is a suitable ratio since there is a bit of a cash buffer without leaving too much capital in a low-return environment.
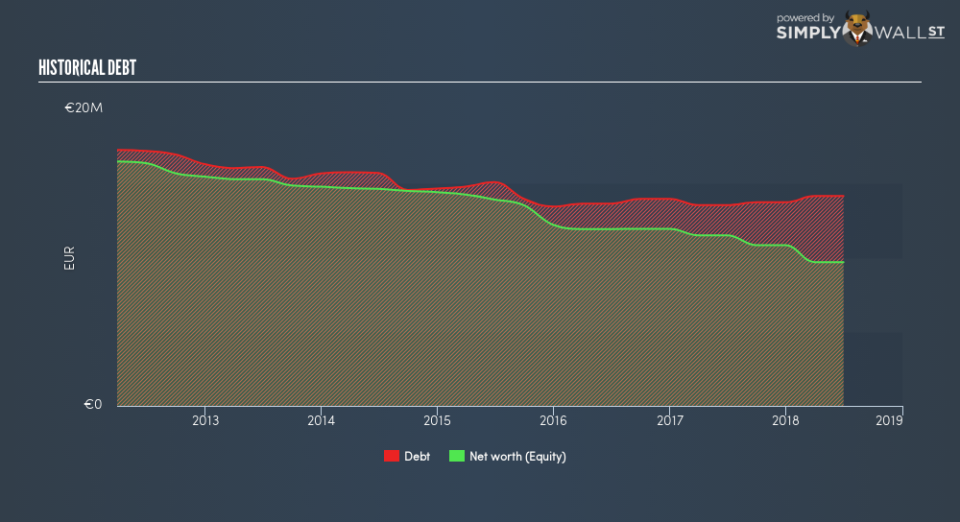
Is VIS’s debt level acceptable?
VIS is a highly-leveraged company with debt exceeding equity by over 100%. This is not uncommon for a small-cap company given that debt tends to be lower-cost and at times, more accessible. But since VIS is presently unprofitable, there’s a question of sustainability of its current operations. Running high debt, while not yet making money, can be risky in unexpected downturns as liquidity may dry up, making it hard to operate.
Next Steps:
VIS’s high cash coverage means that, although its debt levels are high, the company is able to utilise its borrowings efficiently in order to generate cash flow. Since there is also no concerns around VIS’s liquidity needs, this may be its optimal capital structure for the time being. I admit this is a fairly basic analysis for VIS’s financial health. Other important fundamentals need to be considered alongside. I suggest you continue to research VIS Containers Manufacturing to get a better picture of the small-cap by looking at:
Valuation: What is VIS worth today? Is the stock undervalued, even when its growth outlook is factored into its intrinsic value? The intrinsic value infographic in our free research report helps visualize whether VIS is currently mispriced by the market.
Historical Performance: What has VIS’s returns been like over the past? Go into more detail in the past track record analysis and take a look at the free visual representations of our analysis for more clarity.
Other High-Performing Stocks: Are there other stocks that provide better prospects with proven track records? Explore our free list of these great stocks here.
To help readers see past the short term volatility of the financial market, we aim to bring you a long-term focused research analysis purely driven by fundamental data. Note that our analysis does not factor in the latest price-sensitive company announcements.
The author is an independent contributor and at the time of publication had no position in the stocks mentioned. For errors that warrant correction please contact the editor at editorial-team@simplywallst.com.
