
 Yahoo Finance
 Victoria Gold (TSE:VGCX) earnings and shareholder returns have been trending downwards for the last three years, but the stock soars 19% this past week
Victoria Gold Corp. (TSE:VGCX) shareholders will doubtless be very grateful to see the share price up 57% in the last quarter. Meanwhile over the last three years the stock has dropped hard. In that time, the share price dropped 54%. So it is really good to see an improvement. After all, could be that the fall was overdone.
Although the past week has been more reassuring for shareholders, they're still in the red over the last three years, so let's see if the underlying business has been responsible for the decline.
See our latest analysis for Victoria Gold
There is no denying that markets are sometimes efficient, but prices do not always reflect underlying business performance. By comparing earnings per share (EPS) and share price changes over time, we can get a feel for how investor attitudes to a company have morphed over time.
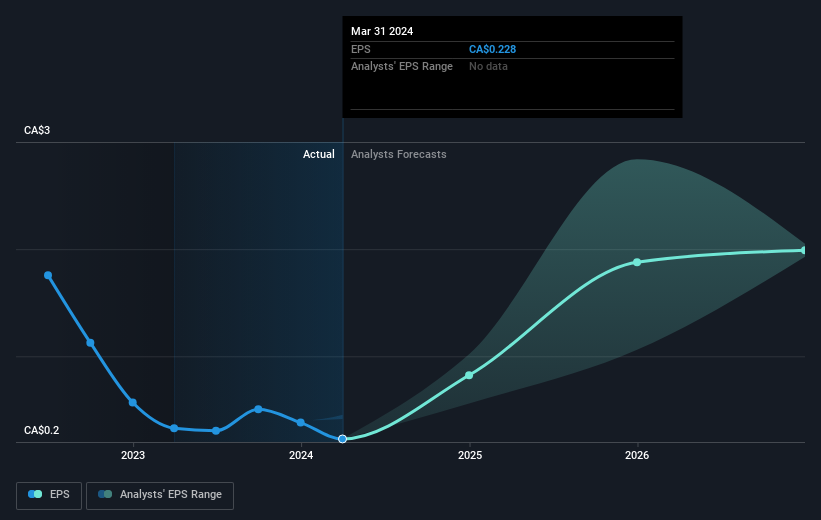
During the three years that the share price fell, Victoria Gold's earnings per share (EPS) dropped by 47% each year. This fall in the EPS is worse than the 23% compound annual share price fall. So the market may not be too worried about the EPS figure, at the moment -- or it may have previously priced some of the drop in.
The image below shows how EPS has tracked over time (if you click on the image you can see greater detail).
We like that insiders have been buying shares in the last twelve months. Having said that, most people consider earnings and revenue growth trends to be a more meaningful guide to the business. This free interactive report on Victoria Gold's earnings, revenue and cash flow is a great place to start, if you want to investigate the stock further.
A Different Perspective
Investors in Victoria Gold had a tough year, with a total loss of 1.3%, against a market gain of about 16%. However, keep in mind that even the best stocks will sometimes underperform the market over a twelve month period. On the bright side, long term shareholders have made money, with a gain of 7% per year over half a decade. If the fundamental data continues to indicate long term sustainable growth, the current sell-off could be an opportunity worth considering. It's always interesting to track share price performance over the longer term. But to understand Victoria Gold better, we need to consider many other factors. To that end, you should be aware of the 1 warning sign we've spotted with Victoria Gold .
There are plenty of other companies that have insiders buying up shares. You probably do not want to miss this free list of undervalued small cap companies that insiders are buying.
Please note, the market returns quoted in this article reflect the market weighted average returns of stocks that currently trade on Canadian exchanges.
Have feedback on this article? Concerned about the content? Get in touch with us directly. Alternatively, email editorial-team (at) simplywallst.com.
This article by Simply Wall St is general in nature. We provide commentary based on historical data and analyst forecasts only using an unbiased methodology and our articles are not intended to be financial advice. It does not constitute a recommendation to buy or sell any stock, and does not take account of your objectives, or your financial situation. We aim to bring you long-term focused analysis driven by fundamental data. Note that our analysis may not factor in the latest price-sensitive company announcements or qualitative material. Simply Wall St has no position in any stocks mentioned.
